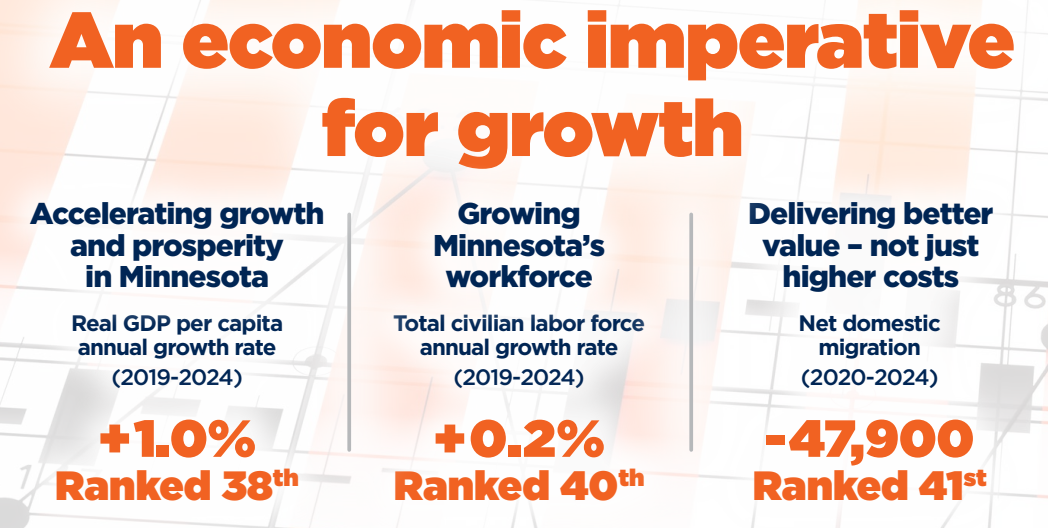
Accelerating growth and prosperity in Minnesota
Key measurement: Growth in Gross Domestic Product (GDP) per capita
What is it and why is it important?
Healthy economic growth rates propel prosperity and living standards. GDP per capita is the broadest and most common measurement of living standards correlated with wages and incomes, productivity, access to goods and services, and overall quality of life.
For business owners, this is the growth of your potential market. Customers have more spending power and businesses sell more goods and services. A growing GDP increases investor confidence, keeping capital flowing into companies and supporting startups. It also indicates that innovation and productivity is growing, essential drivers for increasing incomes and opportunities for employees. Further, growing the economic pie would alleviate the state’s near-term fiscal challenges. Faster economic growth would raise revenues without raising tax rates, which are already higher than other states.
GDP growth in isolation doesn’t tell the whole story. The pace of growth matters in comparison to other states. If Minnesota’s GDP growth is slower than its peers and the national average, it indicates that incomes, investments and living standards are increasing faster in other states than in Minnesota.
What are the trends in Minnesota’s per capita economic output over time?
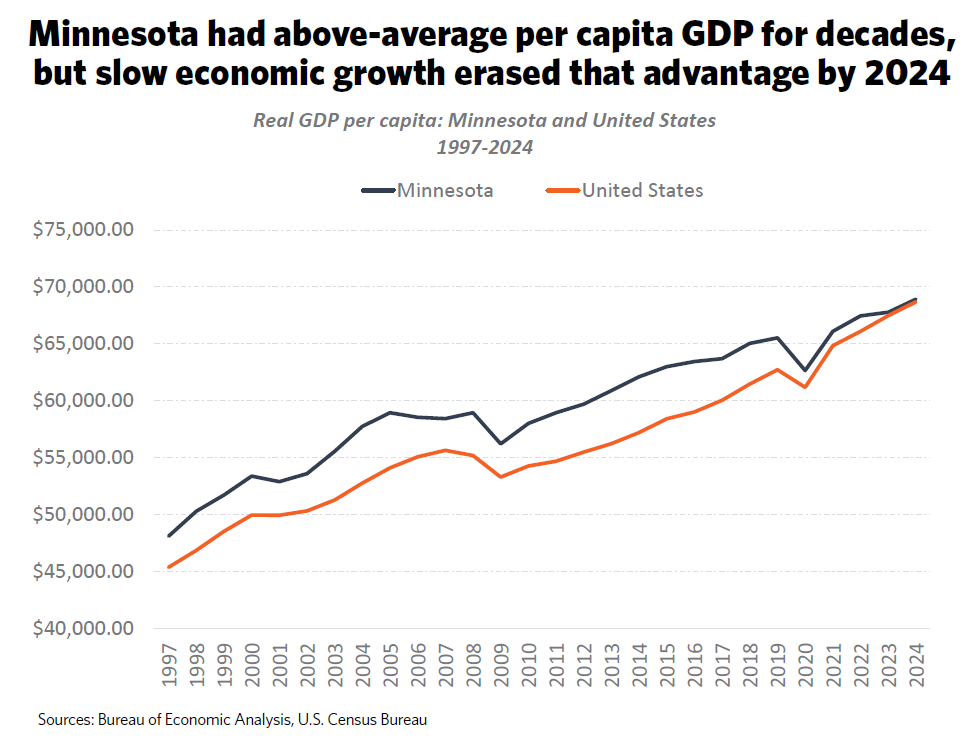
For decades, Minnesota outperformed much of the nation when it came to economic strength. Back in 2004, the state’s economy produced about 9% more value per person than the national average – ranking among the top 10 states in output.
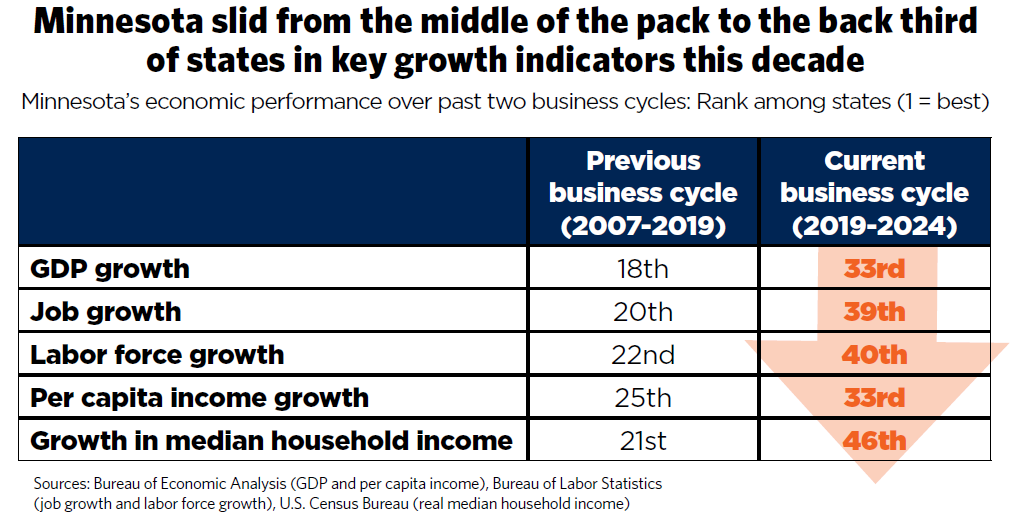
But over the past decade, that edge has steadily slipped. From 2014 to 2024, Minnesota’s economy grew by about 1% per person per year, while the national average grew nearly twice as fast, at 1.8%. That may not sound like a dramatic difference, but over time it adds up, enough for the rest of the country to nearly catch up. By 2024, Minnesota’s per-person economic output was just barely above the U.S. average.
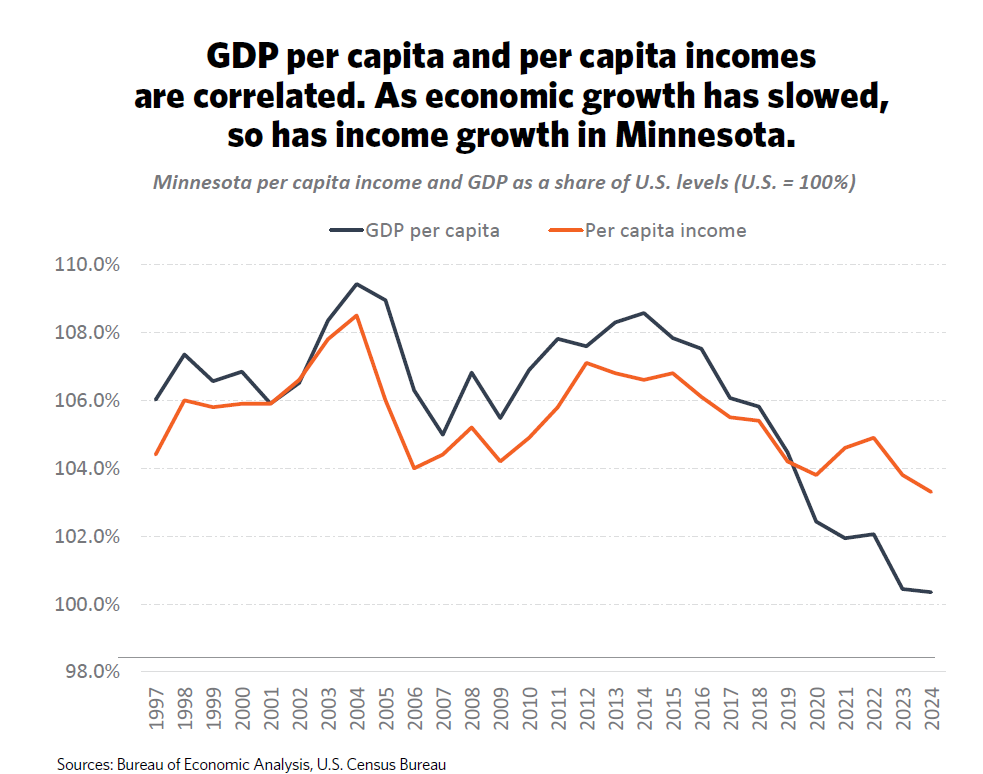
Output per person is closely tied to income. As the economy’s pace has slowed, Minnesotans’ income growth has slowed, too. Minnesotans earn slightly more than the national average now, but that advantage – once a point of pride – has faded year after year.
What drives GDP growth?
At its core, growth comes down to how much a state’s economy can produce with the available time and resources. The biggest factor is productivity – how much value workers and businesses create in each hour of work. Productivity reflects how well a state turns talent, innovation and investments into economic value. Minnesota has a lot of strengths in this area, but also serious challenges slowing momentum.
What’s working in Minnesota’s favor
- Educated and skilled workforce: Minnesota ranks among the top ten states in the share of adults (25 and older) with at least a bachelor’s degree and with an associate or higher – a strong foundation for innovation, productivity and long-term growth.
- Innovation and entrepreneurship: Minnesota produces the 5th-highest number of patents per capita in the nation and has seen a notable uptick in new business creation since 2020.
- Concentration of headquarters and industry strength: Minnesota has 17 Fortune 500 headquarters, the largest concentration of “management of companies” jobs in the U.S. and leads in key areas such as life sciences and food and agriculture innovation.
- Emerging opportunities in advanced sectors: Minnesota is well-positioned to attract investment in fast-growing sectors such as data centers, semiconductors, critical minerals and clean technologies – industries that will help define the next generation of economic growth.
What’s holding us back
- Innovation momentum is slowing: Minnesota remains innovative, but the pace has declined. Patent activity has dropped since 2014, ranking Minnesota 47th in patent growth over the last decade. Research and Development (R&D) output ranks 16th nationally, but R&D growth slipped to 45th in R&D between 2016 and 2021.
- Lagging tech growth: The state’s tech sector continues to expand more slowly than most, ranking 44th in tech job growth in 2024.
- Business climate challenges that limit investment: Employers cite serious and growing concerns about Minnesota’s tax and regulatory environment discouraging investment. The state ranks 44th for overall tax competitiveness, with the 2nd highest corporate rate and 6th highest personal income tax rate. According to a survey from Enterprise Minnesota, over half of manufacturers – 53% – report that the business climate is worsening, particularly due to new labor mandates. This is echoed by focus groups and surveys of Chamber members.
- Education and workforce readiness: Minnesota’s next generation is facing skills gaps. Reading and math scores have dropped sharply, and the state ranks 49th in high schools offering computer science and 44th in college graduates earning STEM degrees – a warning sign for future competitiveness.
Growing Minnesota’s workforce
Key measurement: Growth in total labor force
What is it and why is it important?
Growth in the labor force determines how fast employers can add jobs and increase production of goods and services. To business owners, it’s also a reflection of economic momentum, signaling when it’s time to plan expansions or investment.
Minnesota businesses have consistently reported challenges finding available workers over the past decade, making it harder for them to grow and expand in the state. The shortage of available talent has broad consequences, constraining growth in vital sectors such as housing construction, child care and health care services.
Growth alone isn’t enough; it matters how much Minnesota’s labor force grows relative to other states. Capital, talent and innovation are mobile, and businesses will gravitate to where both workforce and opportunity are expanding.
What are the trends in Minnesota’s labor force over time?
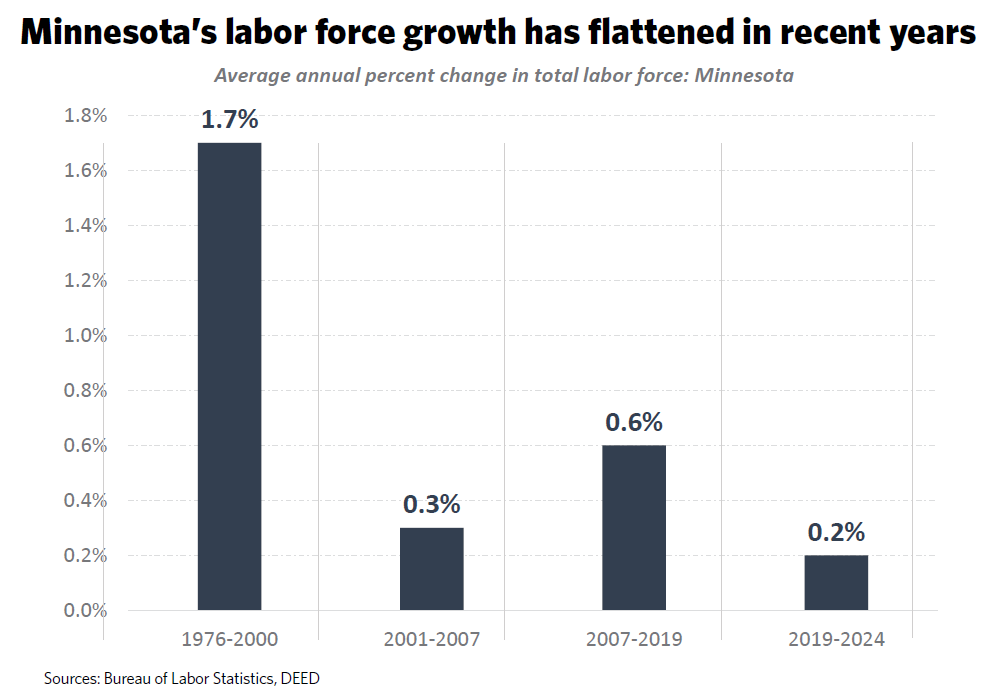
Minnesota’s labor force grew steadily for decades, expanding by about 1.7% per year from 1976 to 2000. Since then, growth has slowed dramatically, and the challenge has deepened in recent years. Between 2019 and 2024, the state only added 24,701 workers, an average increase of just 0.2% annually.
Nearly 90,000 people left the labor force in the first year of the pandemic, as retirements accelerated and many stepped away for other reasons. While the trend has improved since 2021 and Minnesota is again adding workers, the pace still falls short of meeting employer demand. As of 2025, there continued to be nearly two job openings for every one job seeker.
What impacts labor force growth and what are Minnesota’s opportunities to accelerate growth?
Labor force growth is influenced by a combination of growth in the number of working-age adults (population growth) and the share of the adults participating in the workforce (labor force participation rates). A combination of population growth and removing barriers for individuals on the economic sideline can help address workforce shortages.
What’s working in Minnesota’s favor
- Expanding participation among underrepresented groups: While workforce participation rates remain uneven across demographic groups, Minnesota has seen encouraging progress in recent years. Labor force participation among working-age people of color has risen by more than 11 percentage points since 2011 – from 62.4% to 73.5% in 2024. Similarly, participation among individuals with disabilities increased by 11 points between 2012 and 2023, reaching a record high of 60%.
- Immigration: Positive international migration has helped sustain population and labor force growth in Minnesota in the first quarter of the century. This impact has only increased in recent years, with 94% of Minnesota’s net population growth coming from immigration from 2020-2024. The state’s foreign-born labor force grew by 41% since 2010, compared to just 4% for U.S.-born Minnesotans.
What’s holding us back
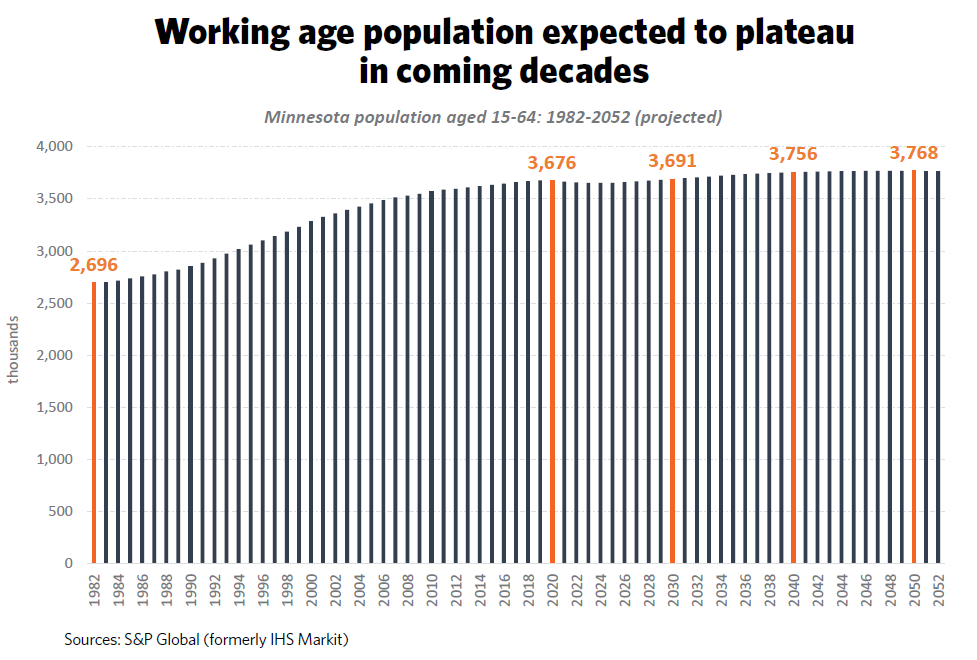
- Aging population and declining birth rates: As Minnesota’s baby boomer generation continues to retire, fewer young adults are entering the workforce to replace them. Declining birth rates have led to smaller incoming generations, creating one of the main factors behind the state’s slowing labor force growth over time.
- High labor force participation leaves little room for expansion: Minnesota already ranks among the top states for labor force participation – 6th in the nation in 2025. Nearly 80% of working-age adults (aged 16-64) are either employed or actively seeking work. Because participation is already so high, there is a relatively small pool of working-age adults still on the sidelines.
- Challenges retaining and attracting residents: Despite strong international migration, Minnesota has consistently lost residents to other states since 2000 (see next section). Looking ahead, shifts in federal immigration policy may further slow international migration, putting additional pressure on the state’s future labor supply.
Delivering better value – not just higher costs
Key measurement: Net domestic migration
What is it and why is it important?
Net domestic migration measures the number of U.S. residents moving to Minnesota compared to the number of Minnesotans moving to other states. Positive net domestic migration matters for two key reasons. First, it directly affects the size of Minnesota’s population and workforce. Second, it serves as a barometer of the state’s overall attractiveness – showing where people choose to live, work and build their futures.
People “vote with their feet.” When they choose to move from one state to another, they make a real-world judgment about where opportunity, affordability and quality of life are strongest. If they are moving away, it could suggest that they see better job prospects and a better cost of living elsewhere. Competitiveness factors – such as affordability – are likely to affect where people choose to move.
What are the trends in Minnesota’s net domestic migration?
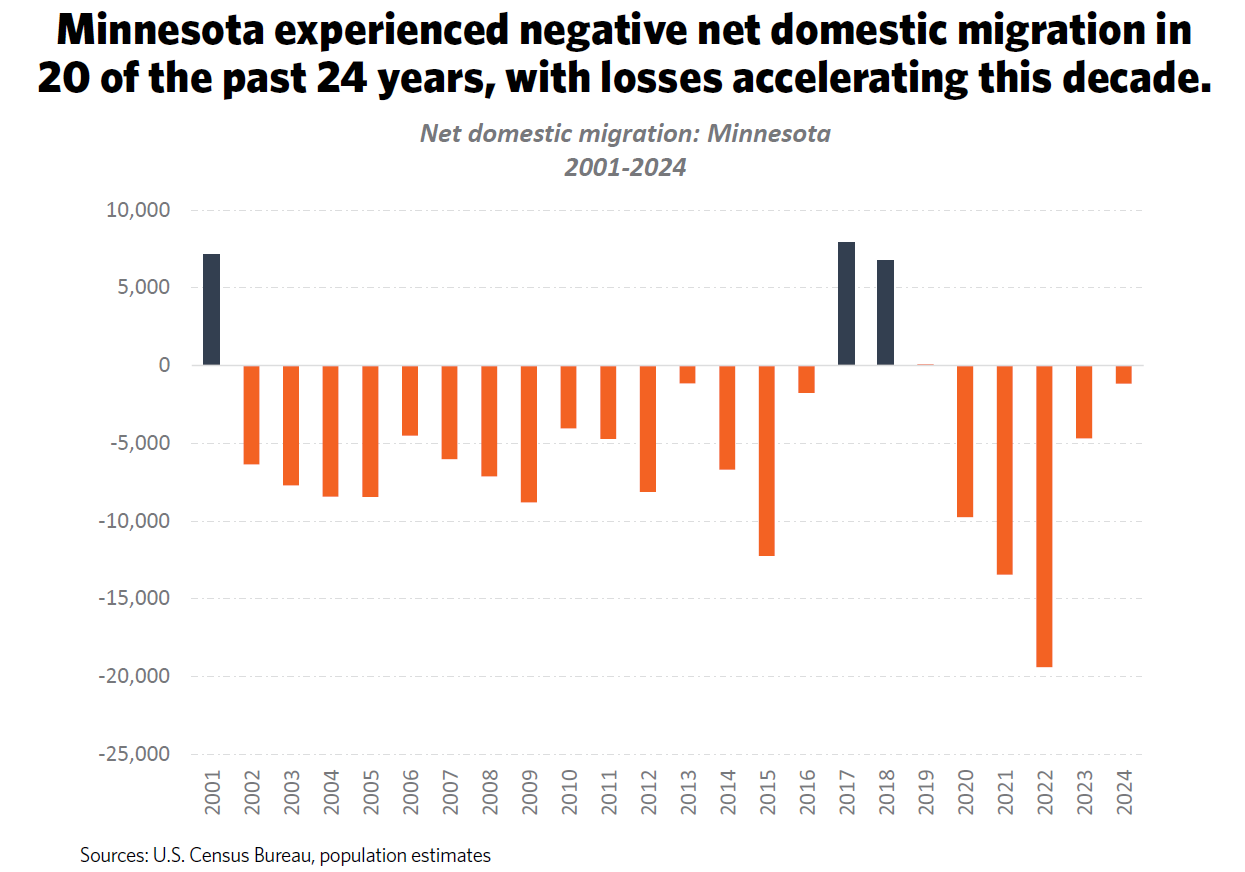
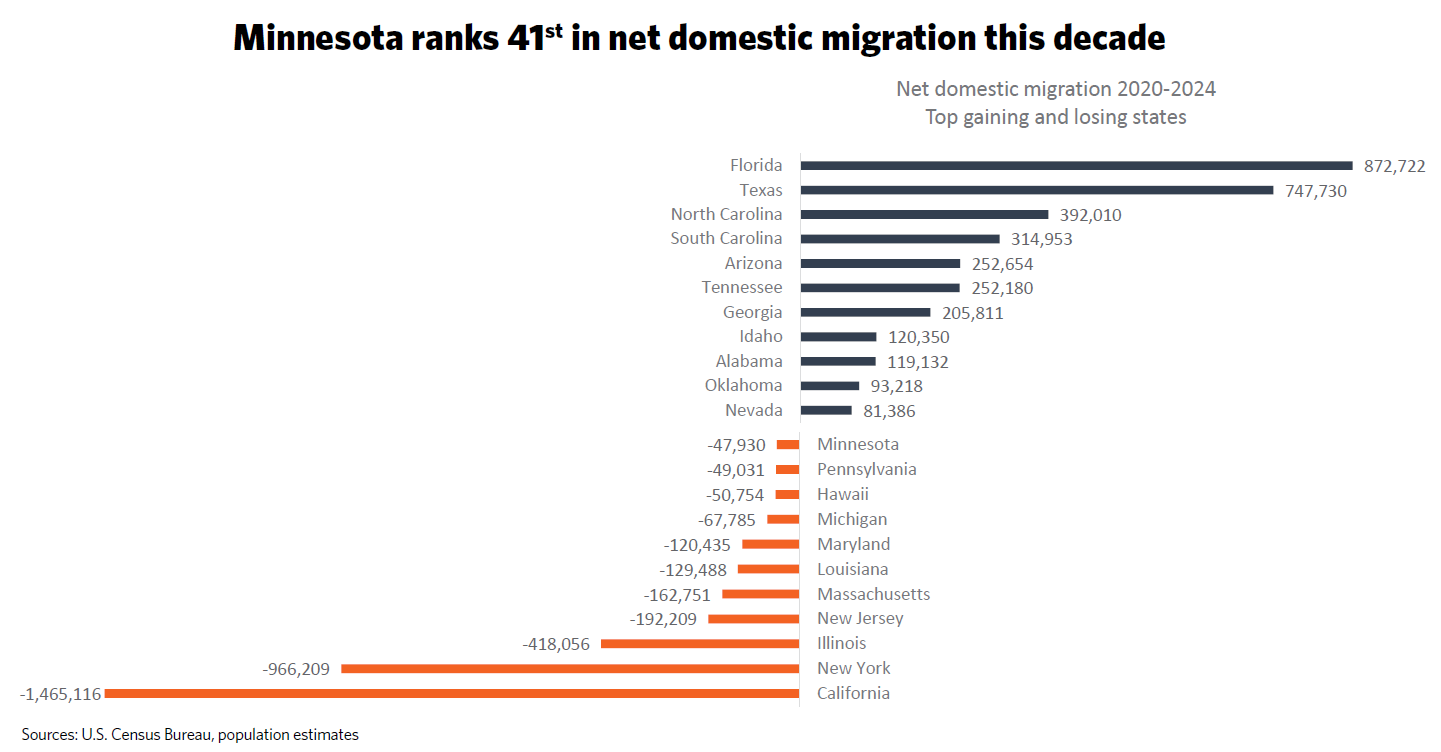
While Minnesota attracted new residents throughout the 1990s, the trend has reversed in recent decades. The state has experienced negative net domestic migration in 20 of the past 24 years, with losses deepening in the early 2020s. Since 2001, nearly 123,000 more people have left Minnesota than moved in. Between 2020 and 2024 alone, the state saw a net loss of 47,930 residents to other parts of the country, ranking 41st among states. Encouragingly, those losses have begun to stabilize, with migration outflows moderating in 2023 and 2024.
According to several measurements, Minnesota’s taxes have grown faster than perceived value. For example, states’ tax competitiveness rankings were positively correlated with net domestic migration outcomes from 2020 to 2024, with migration flowing to lower tax states.
What’s working in Minnesota’s favor
- Minnesota’s quality of life is a powerful draw: Minnesota often finds itself near the top of the list for a variety of indicators related to education, health care and outdoor amenities. These qualities are meaningful “pull factors” that draw people to Minnesota and retain them once they’re here.
- Innovative companies draw talent from around the U.S. and the world: Minnesota’s industry-leading companies, along with its strong college and university system, help draw skilled workers from across the nation and around the globe.
What’s holding us back
- Limited housing and child care driving up costs: Minnesota faces a well-documented shortage of housing units, constraining the state’s ability to accommodate new residents. This challenge is compounded by ongoing child care shortages, as rising costs and regulatory burdens make it difficult to expand capacity in both sectors.
- Losing young talent to other states: According to a 2024 report from the Minnesota State Demographic Center, Minnesota experiences a net loss of about 8,300 college-age students to other states each year. While some return after graduation, their numbers fall short of offsetting the initial outflow – a trend with long-term implications for the state’s talent pipeline.
- Minnesota’s cost of living is higher than neighboring states: Compared to nearby states, Minnesotans face higher overall taxes and living expenses. Because most people who move across state lines relocate within the region, these cost differences have an outsized impact on migration patterns. Minnesota’s cost of living ranks 19th highest in the nation, while neighboring states rank much lower – Iowa (44th), North Dakota (45th) and South Dakota (48th).