Trends in Minnesota’s Regional Economies
Minnesota has a diverse economy with strengths across many industry sectors. Part of this economic diversity comes from the state’s distinct regional economies. Each region possesses its own local advantages and specialized industries that contribute to the overall statewide economy.
Yet, outcomes in the statewide economy can obscure trends and variations at the local and regional level. This article looks at how Minnesota’s economic regions performed over the first four years of the decade and assesses changes in each region’s key industry clusters.
Note: This analysis uses the Department of Employment and Economic Development (DEED) planning regions as the base definition for Minnesota’s economic regions. The source data for all employment and wage data in this article is from the Quarterly Census of Employment and Wages, and all GDP data is from the Bureau of Economic Analysis.
How did Minnesota’s economic regions perform in the first four years of the decade?
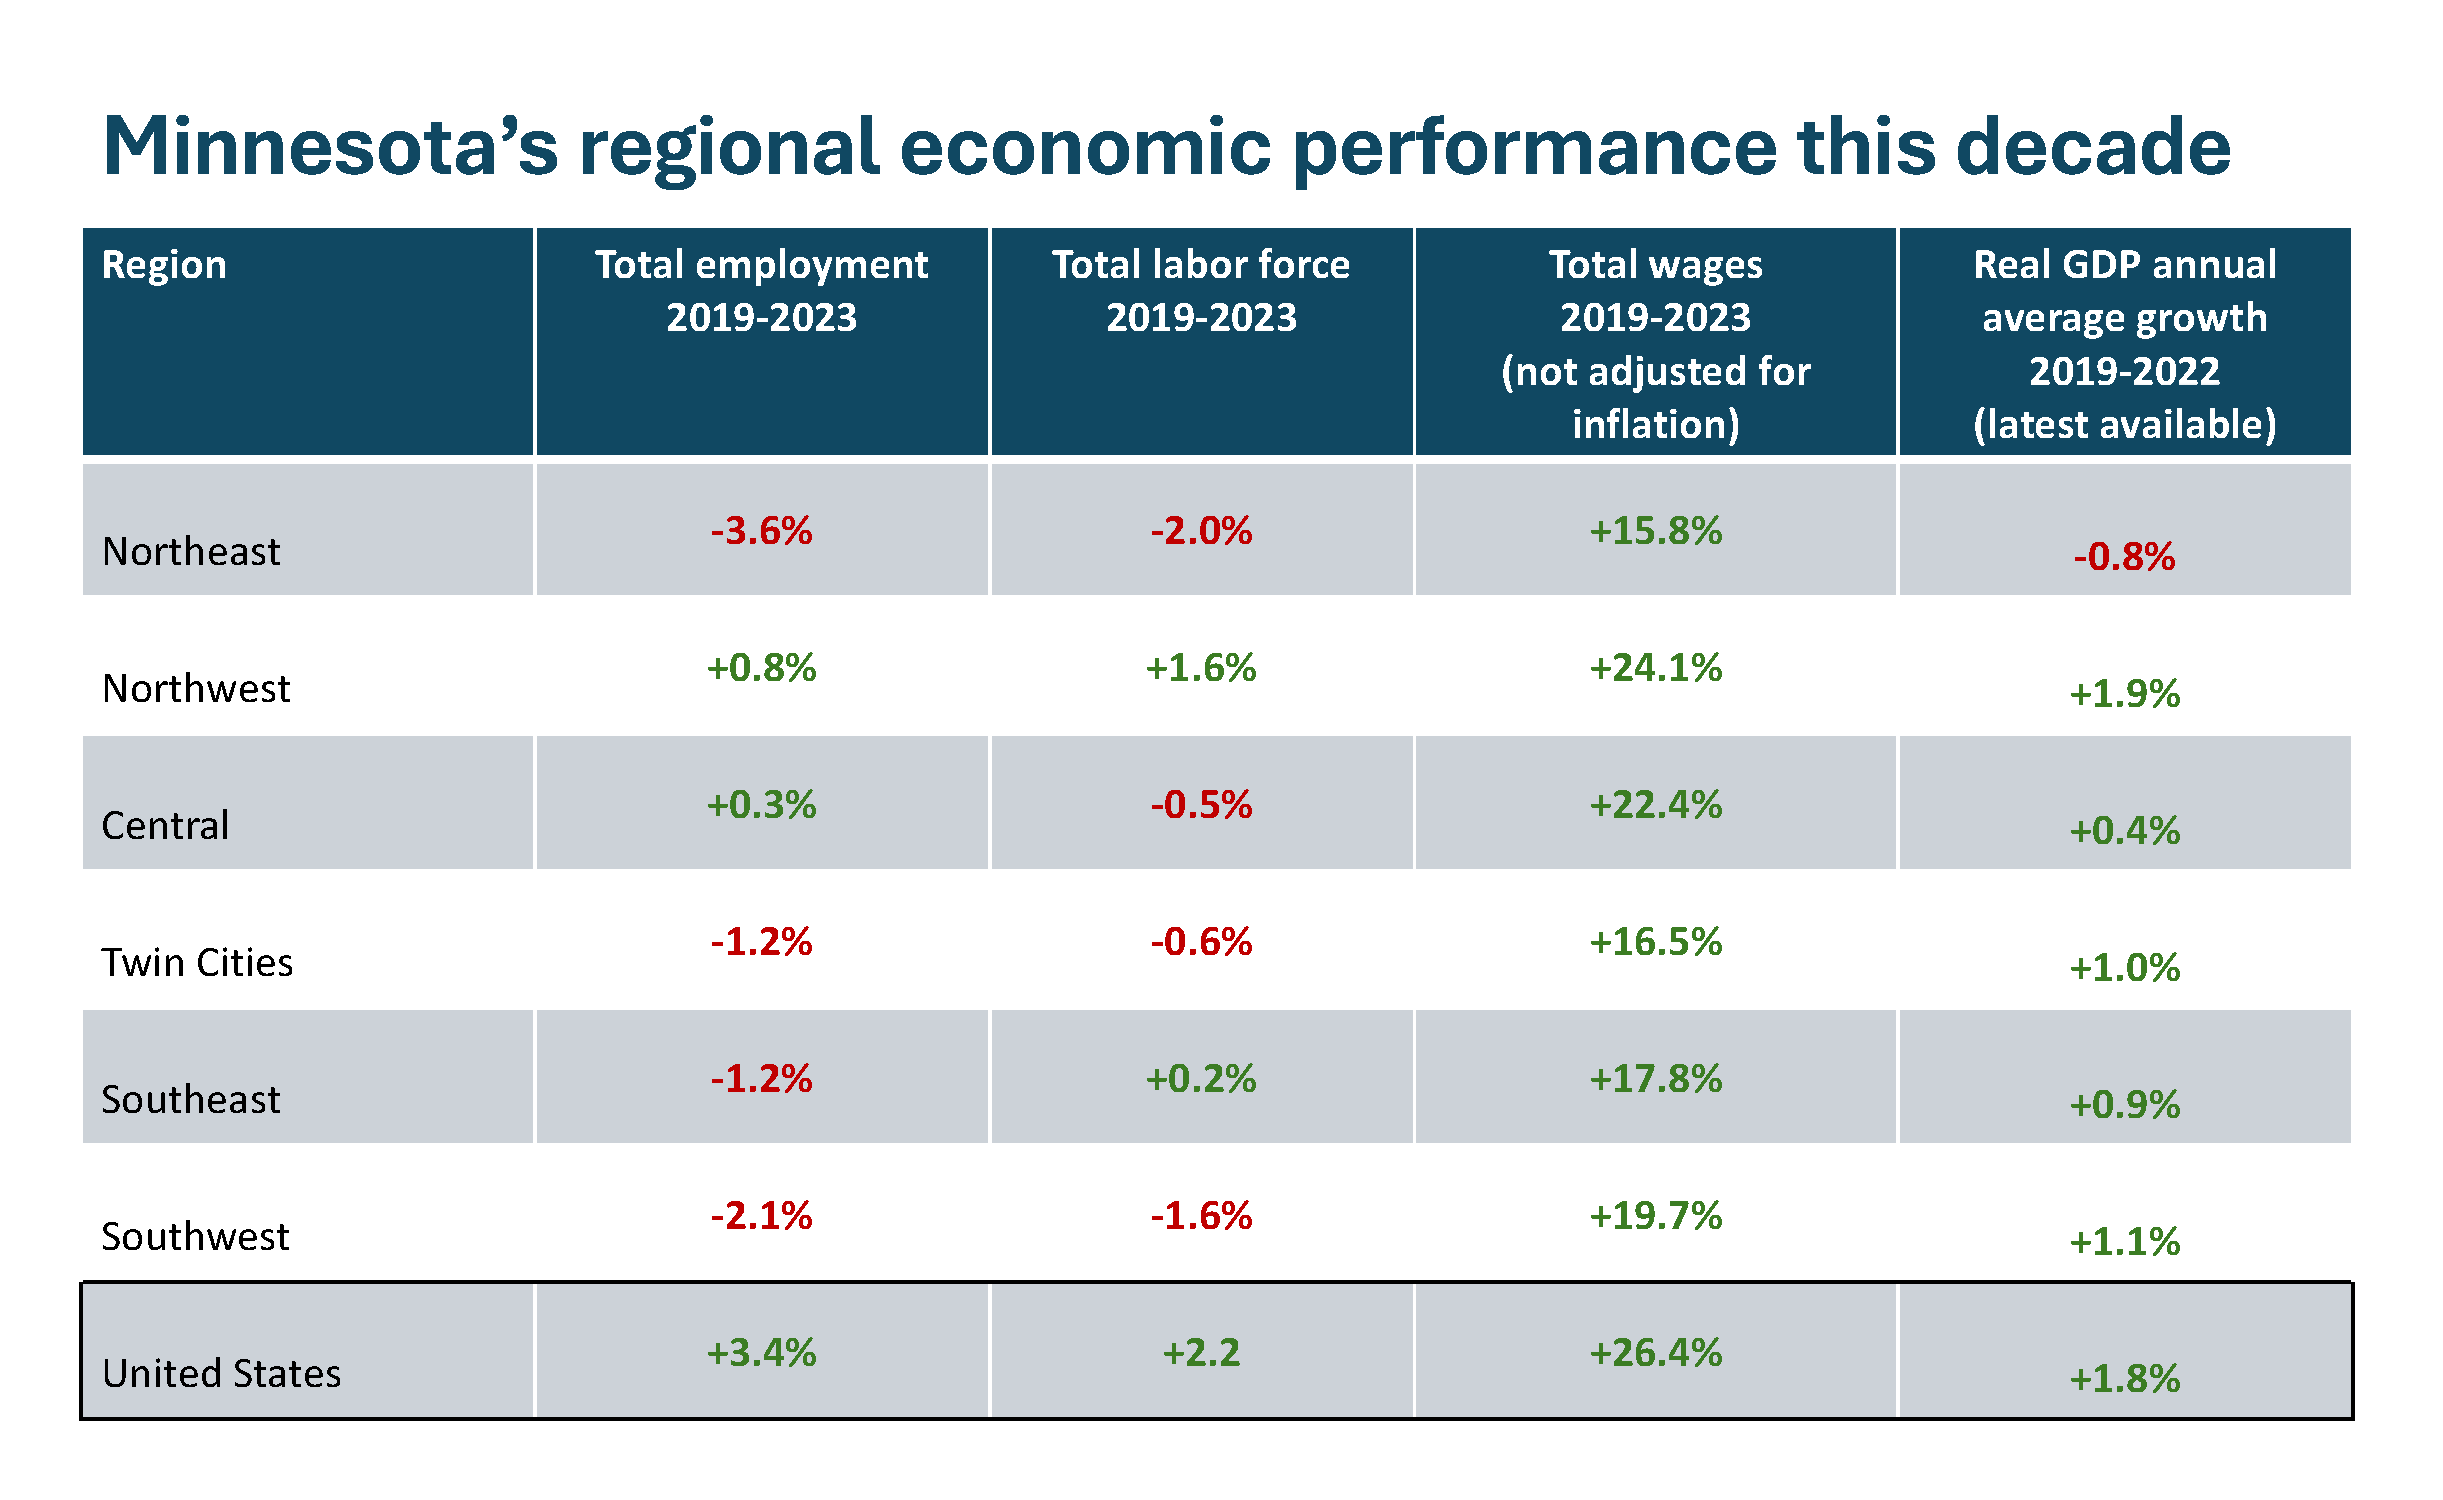
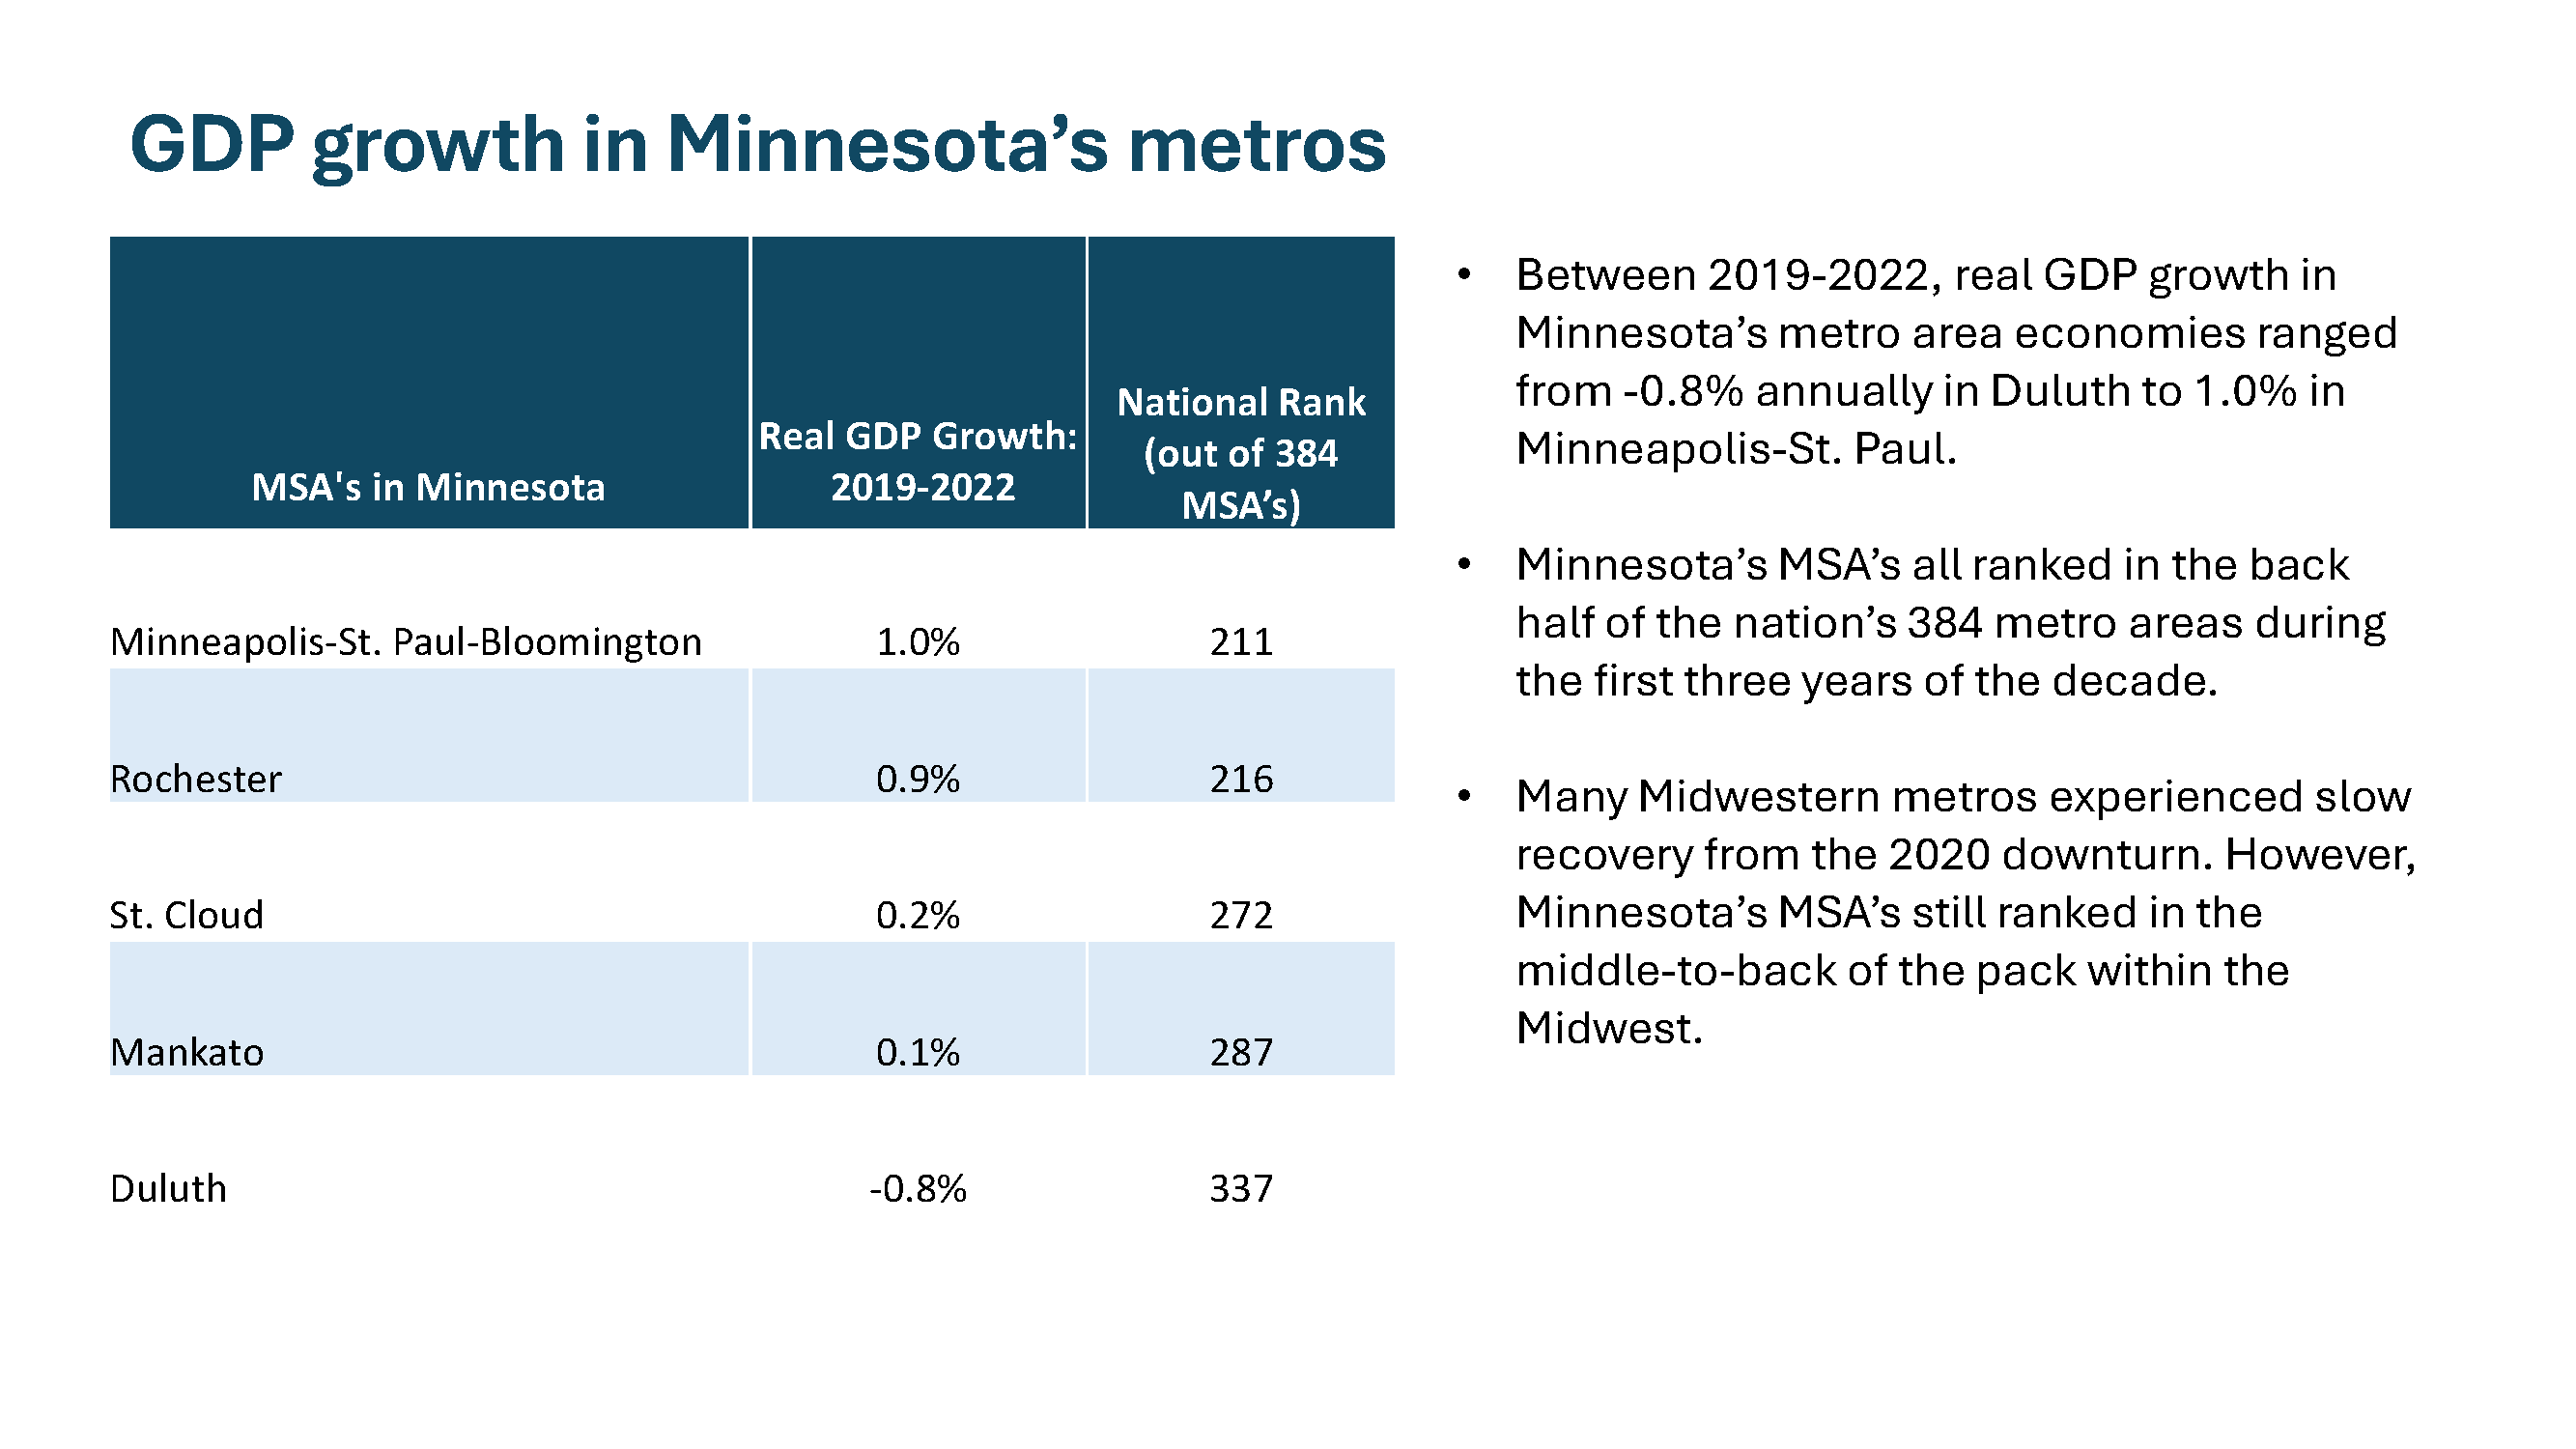
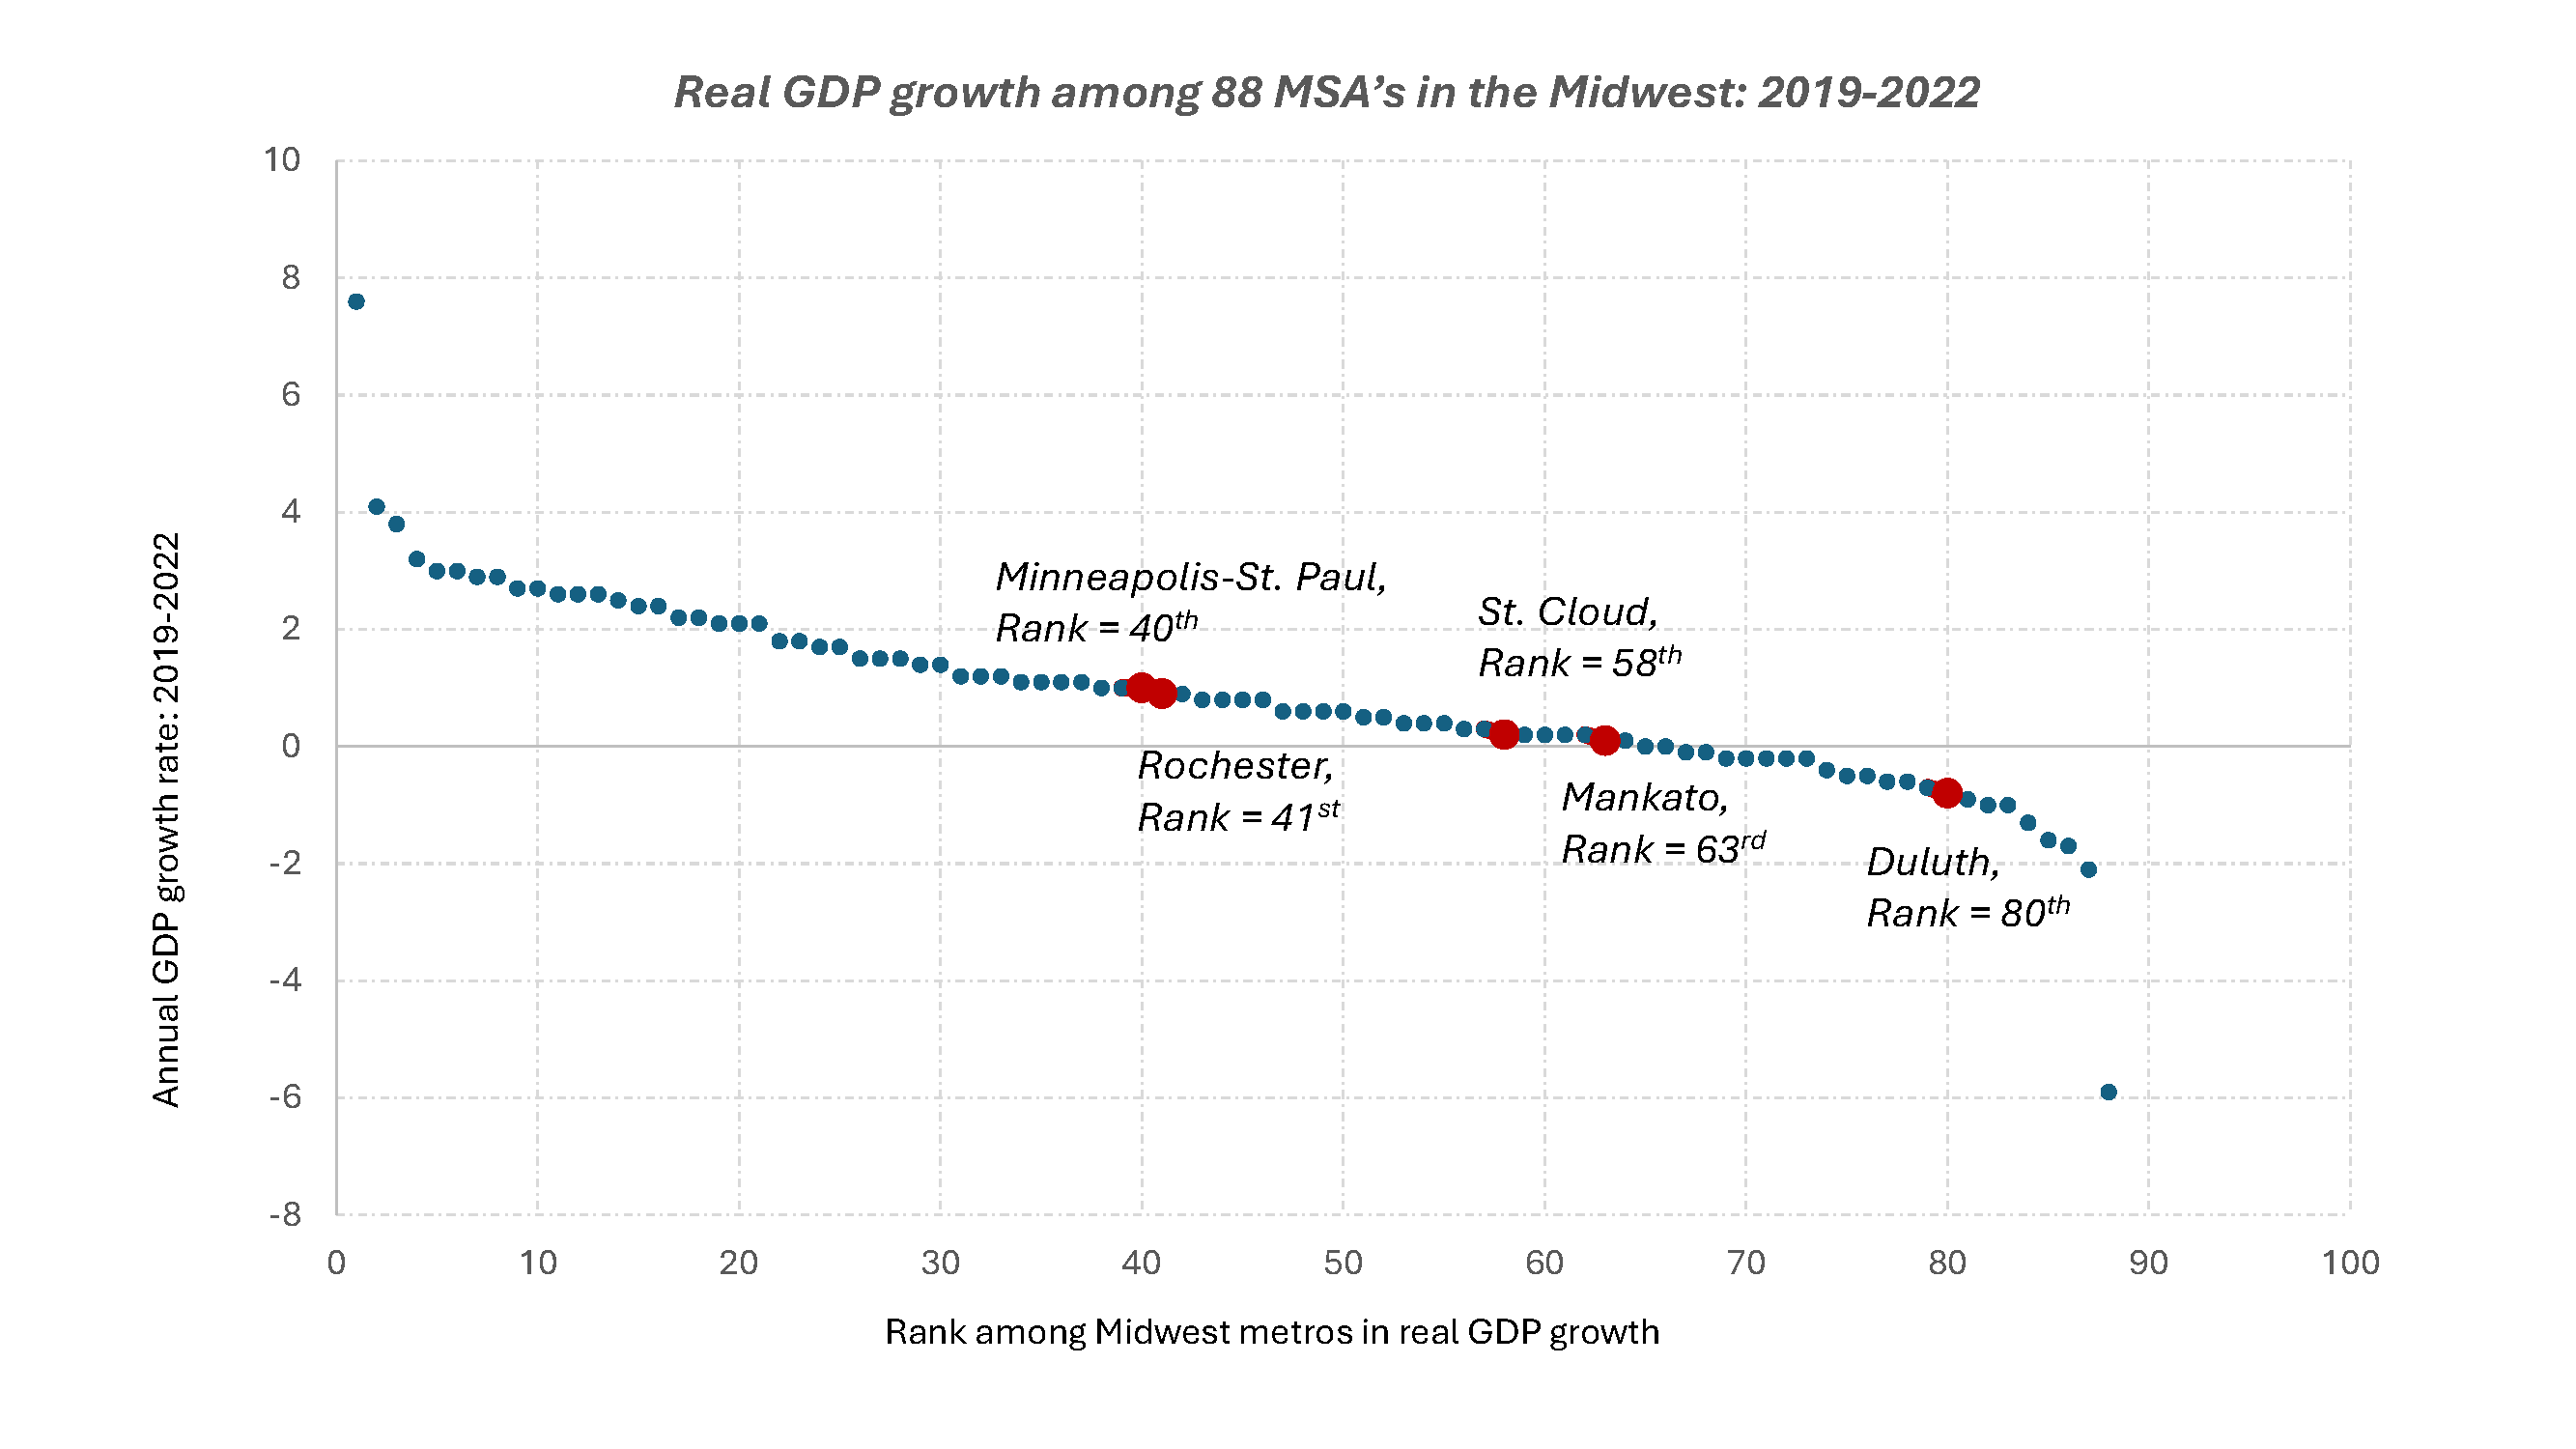
- Minimal growth in regional economies: Four of six regional economies experienced net declines in jobs and total labor force from 2019-2023. Further, each region in Minnesota underperformed the U.S. economy so far this decade. The Twin Cities, which anchors the state’s economy, lost 1.2% of total employment from 2019-2023, compared to the U.S. which increased jobs by 3.4% in that time. Despite weak job recovery, each region saw positive gains in total payroll since 2019, and all but one (Northeast Minnesota) had positive GPD growth from 2019-2022 (latest available data for county/regional GDP).
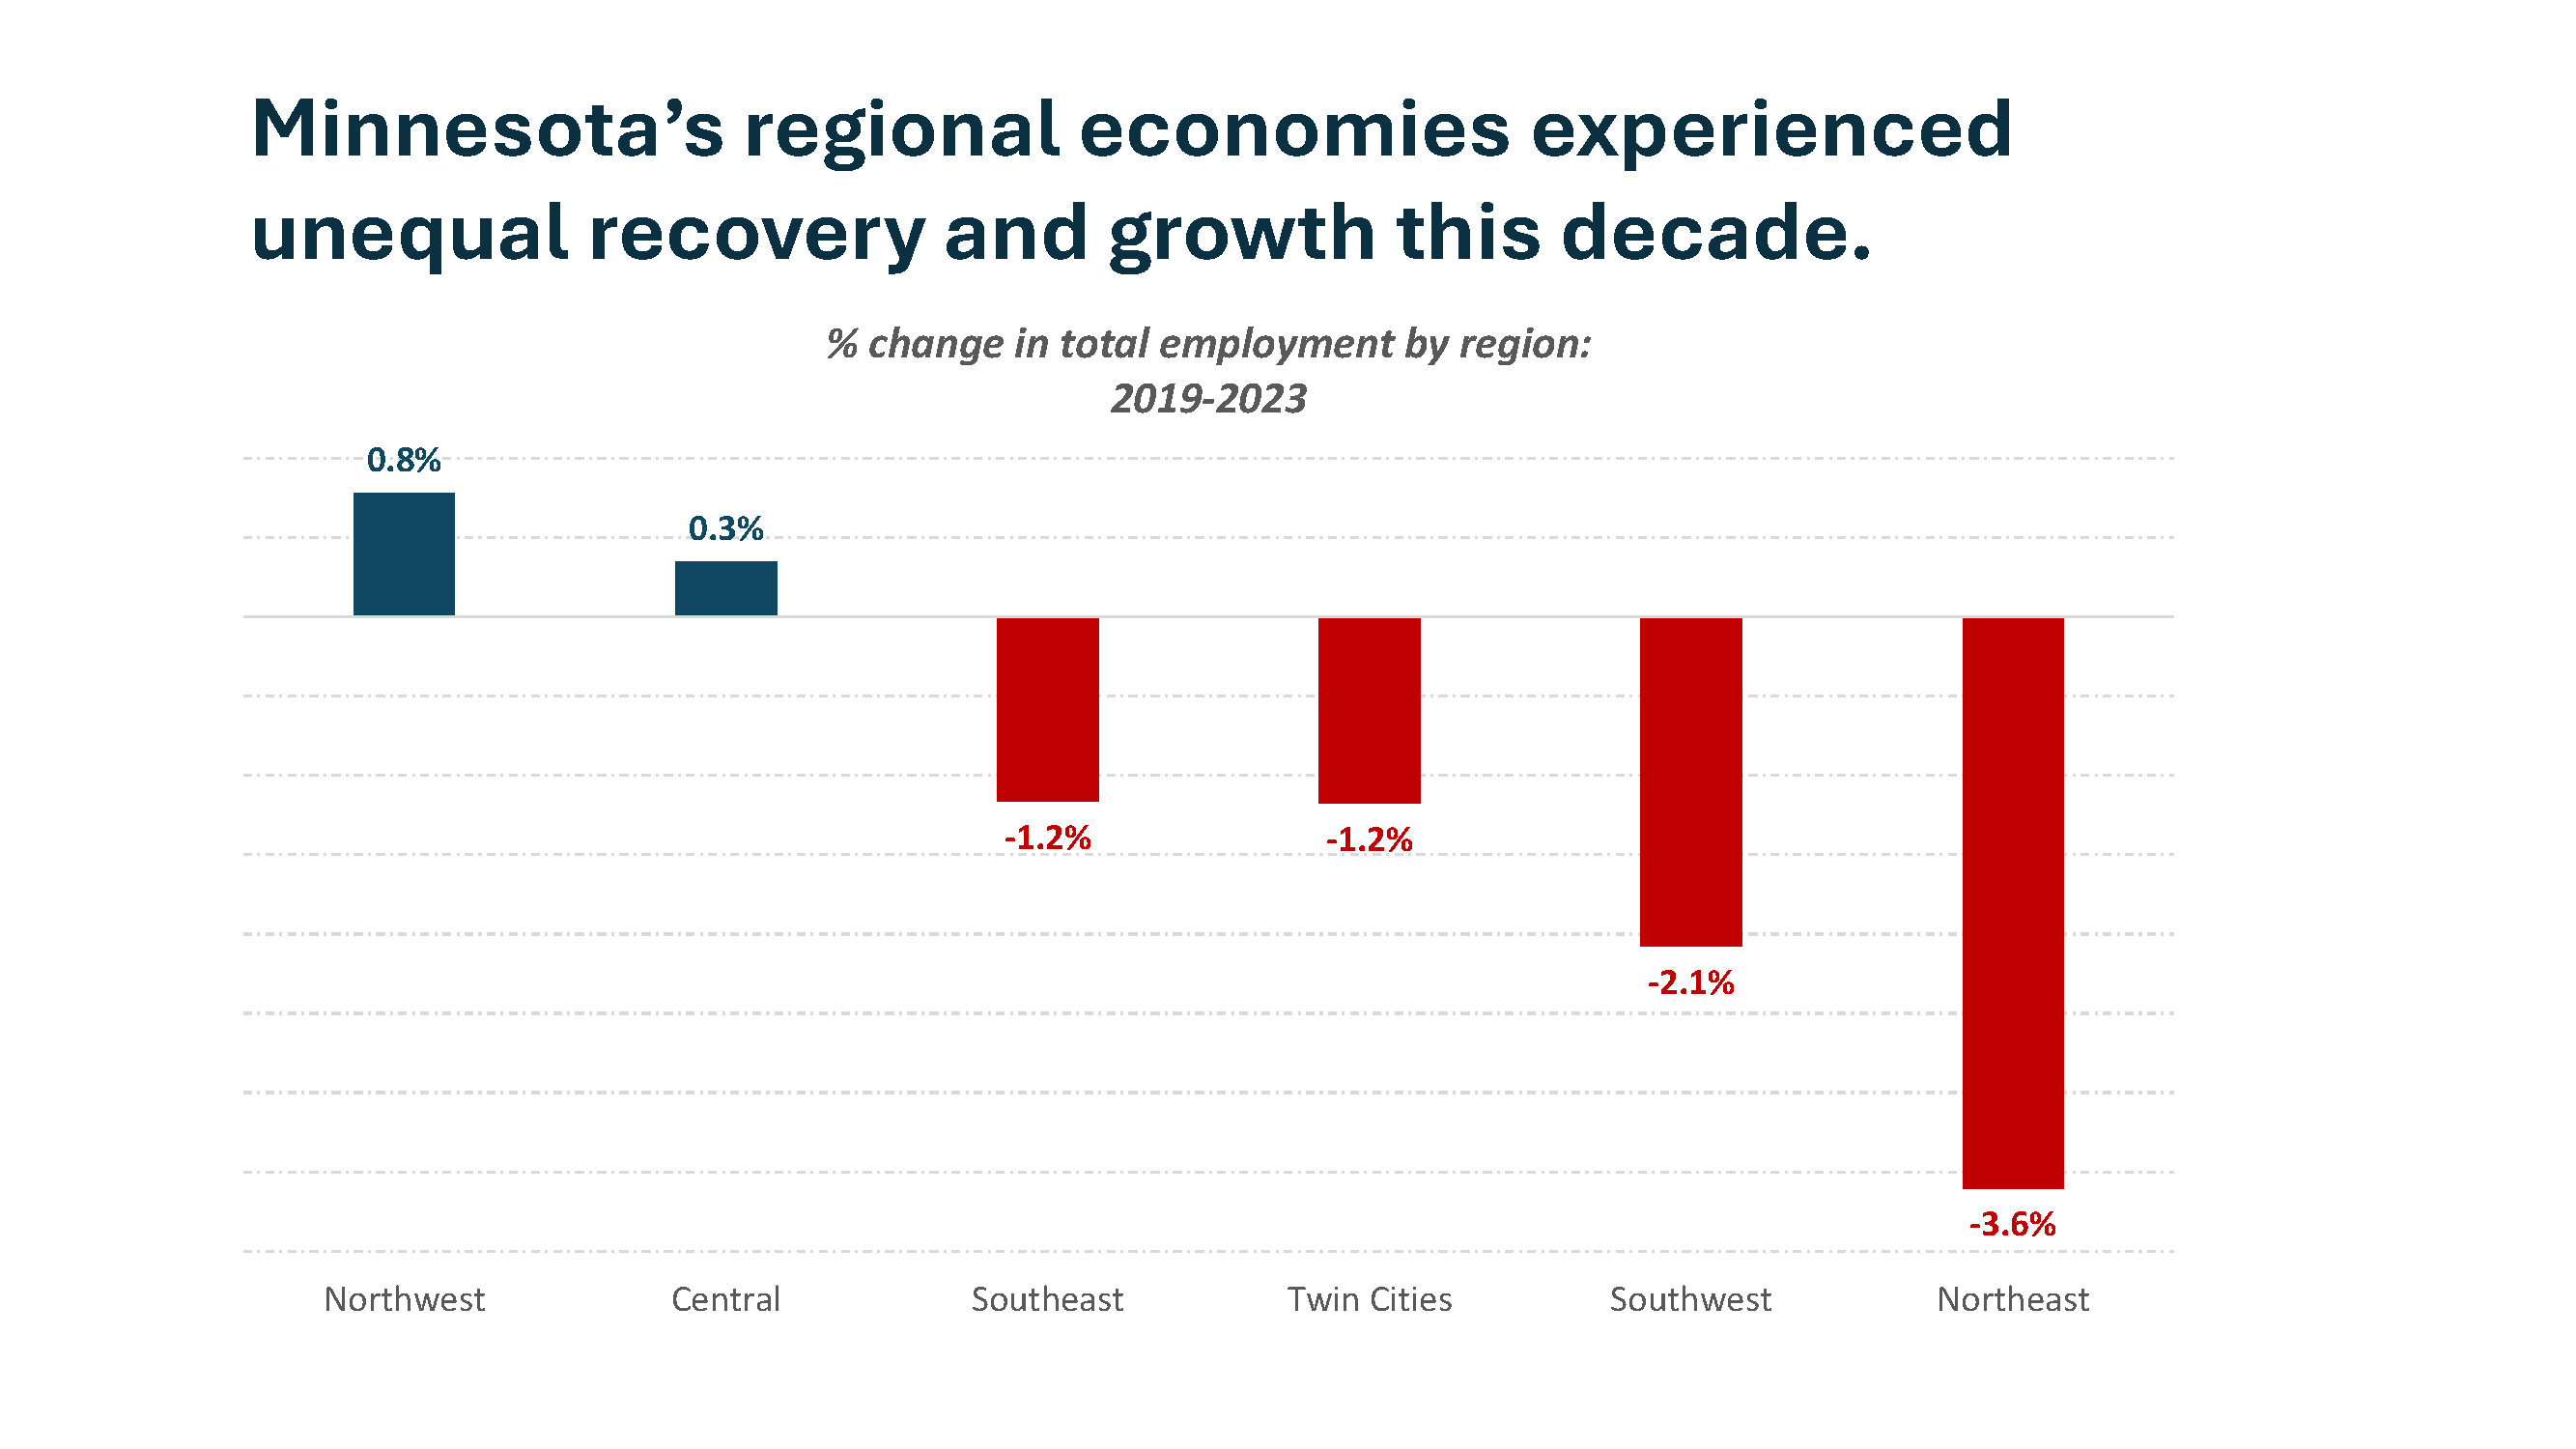
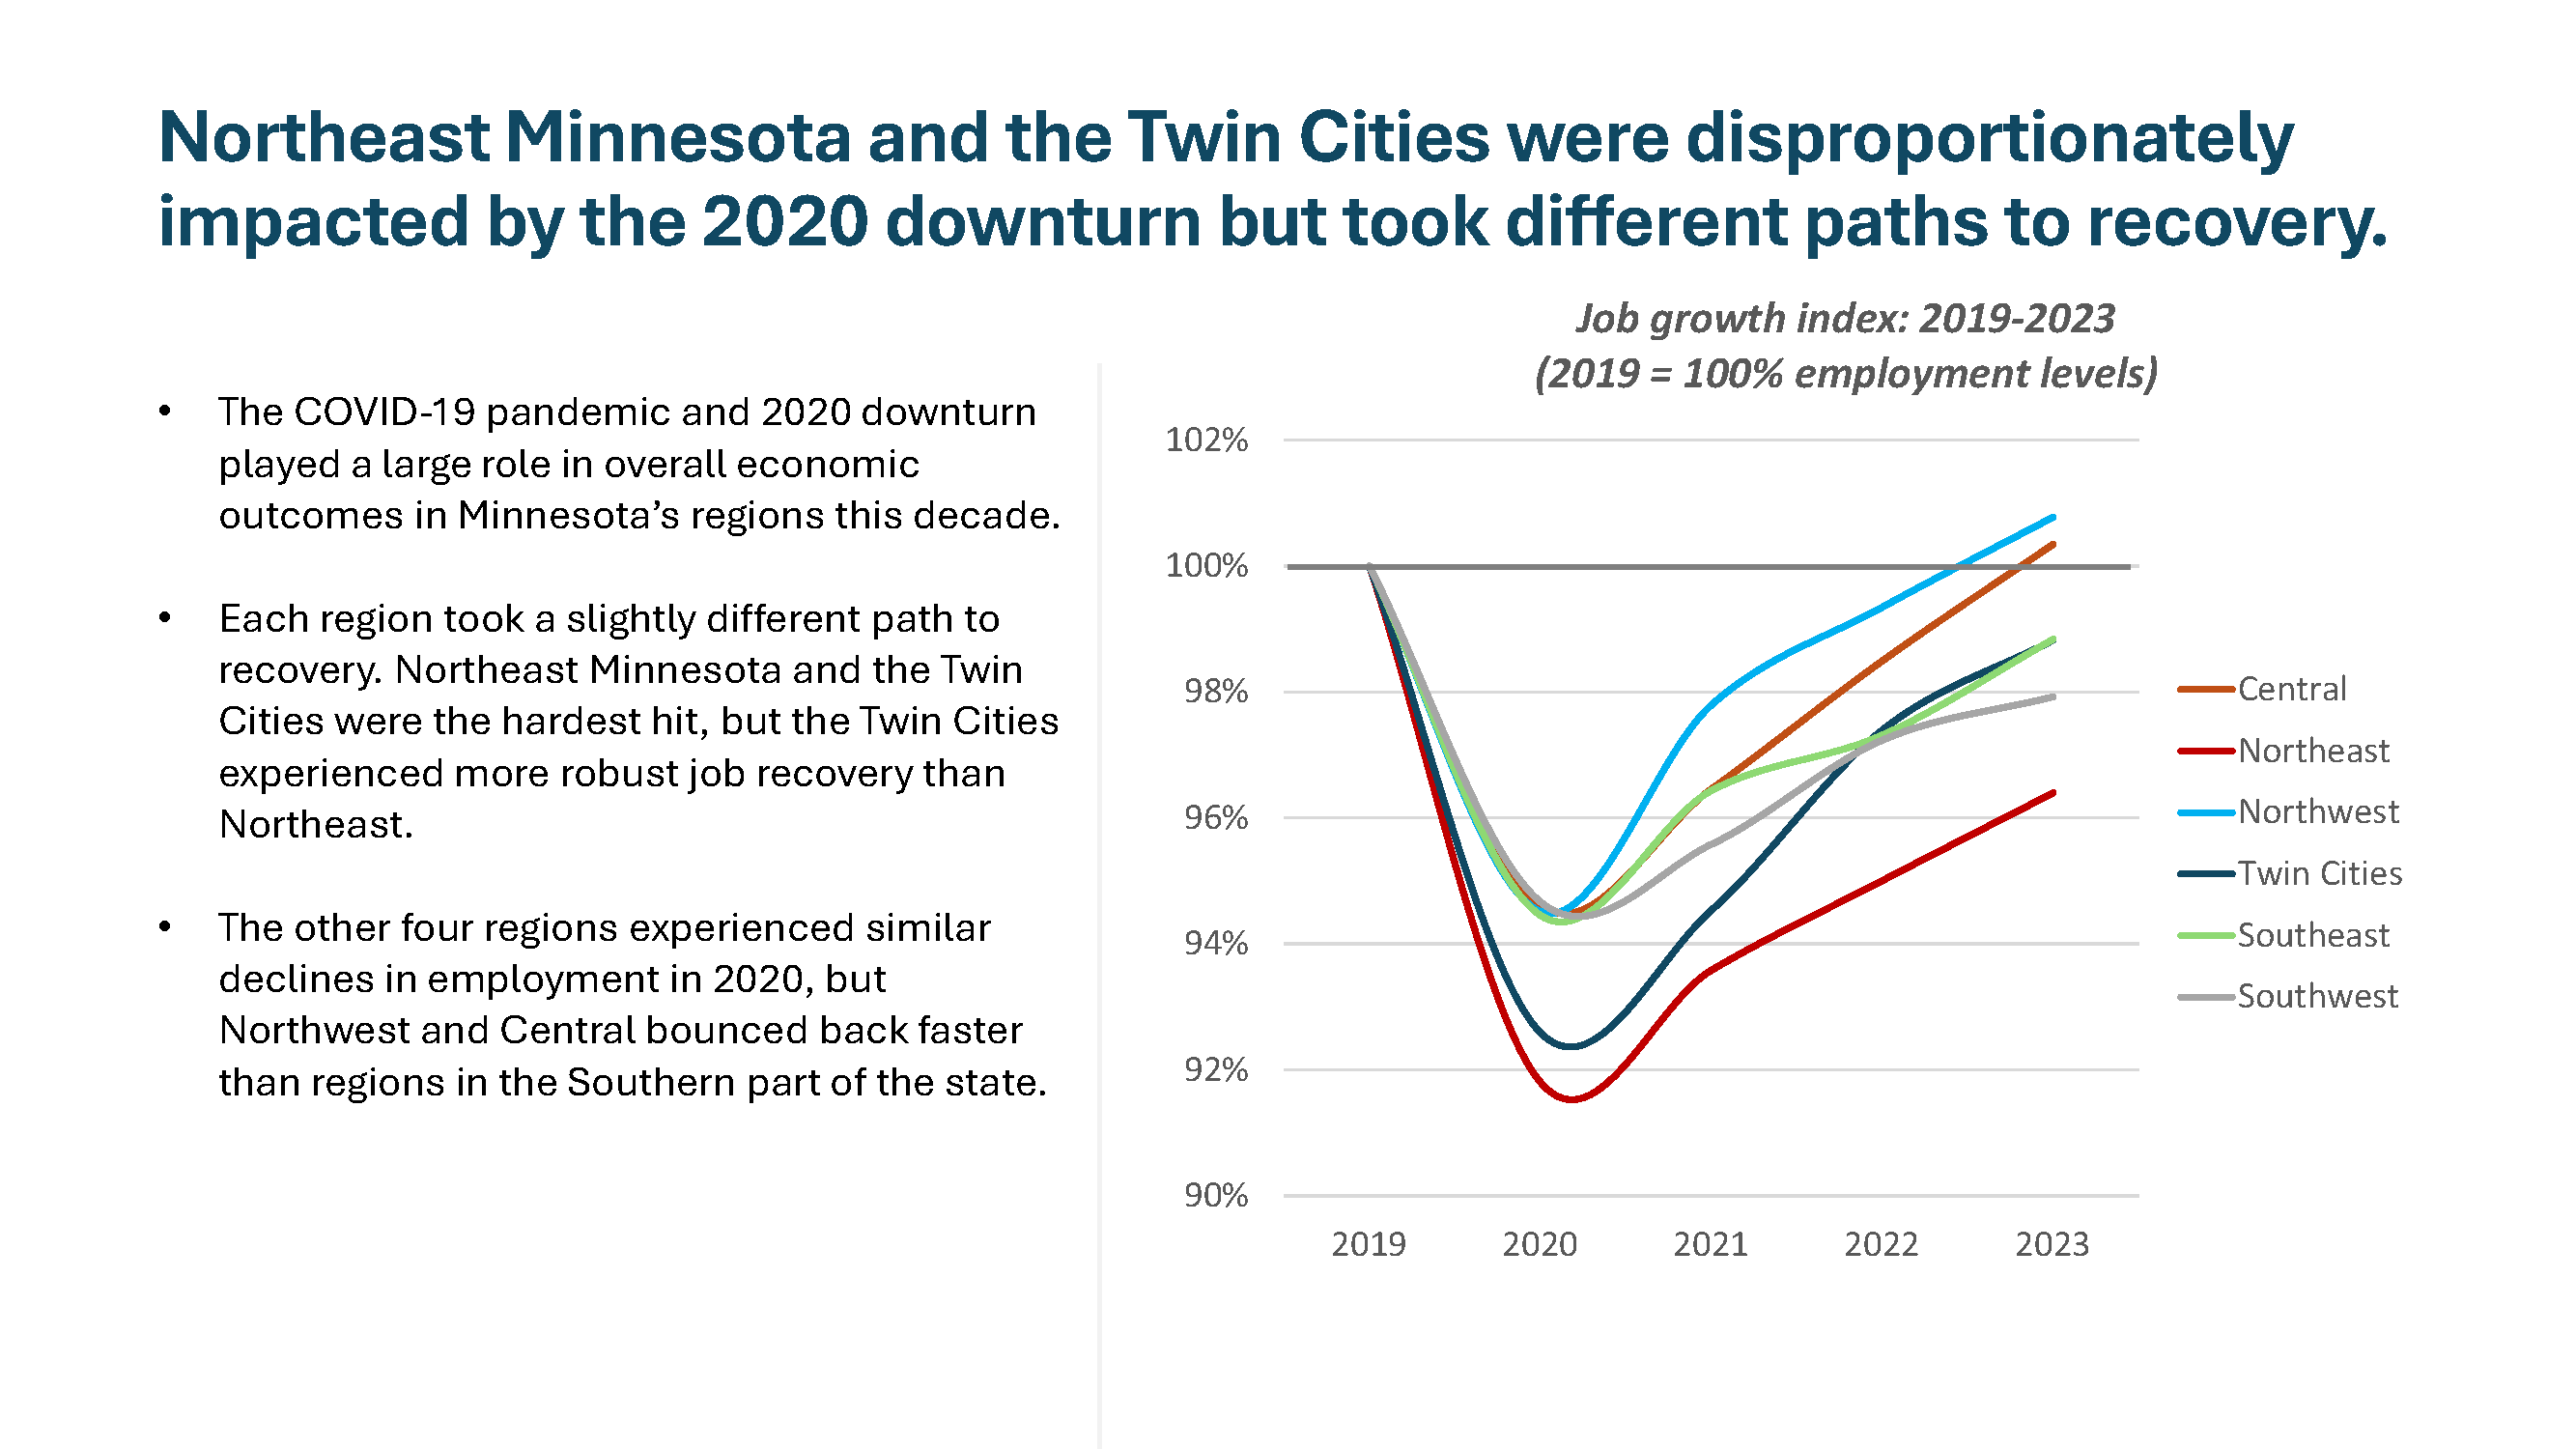
- Uneven recovery and growth across regions: From 2019-2023, Minnesota’s regional economies recovered and grew at an uneven pace. Two regions – Northwest and Central Minnesota – had more jobs in 2023 than they did in 2019. Northeast and Southwest Minnesota faced the steepest job losses over the first four years of the decade, declining by 3.6% and 2.1% respectively. Below is a further breakdown of performance by region:
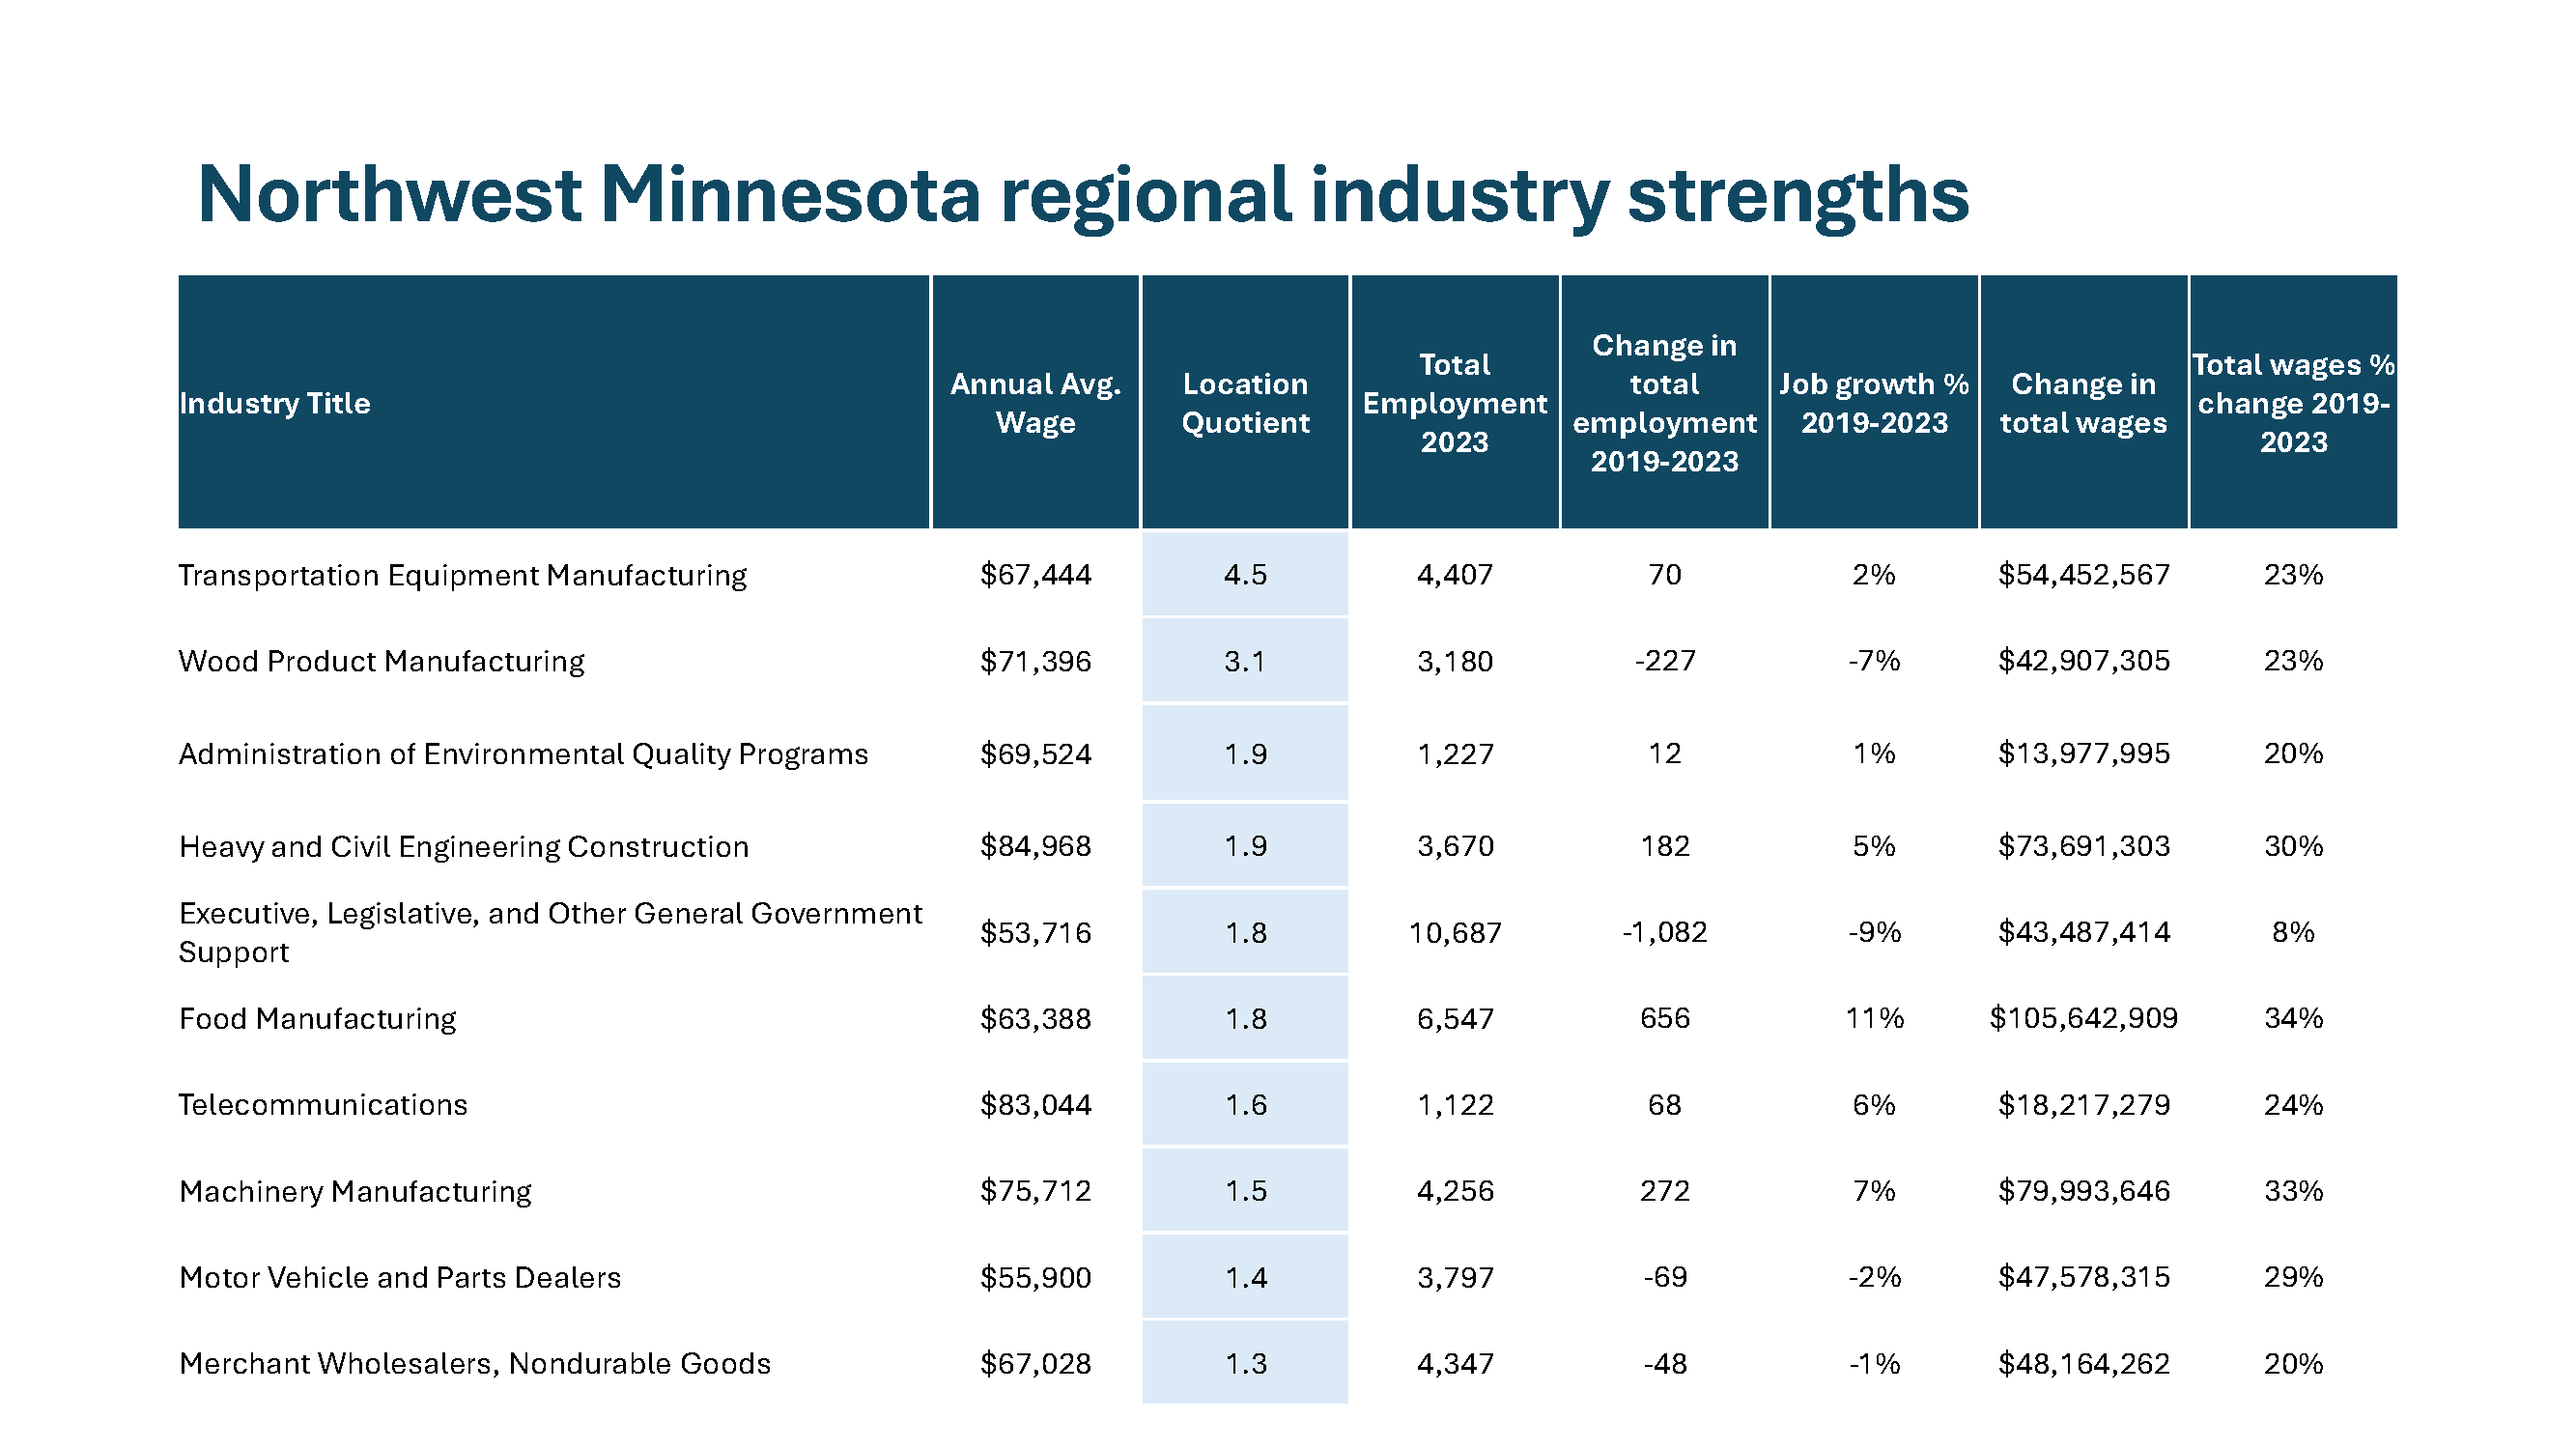
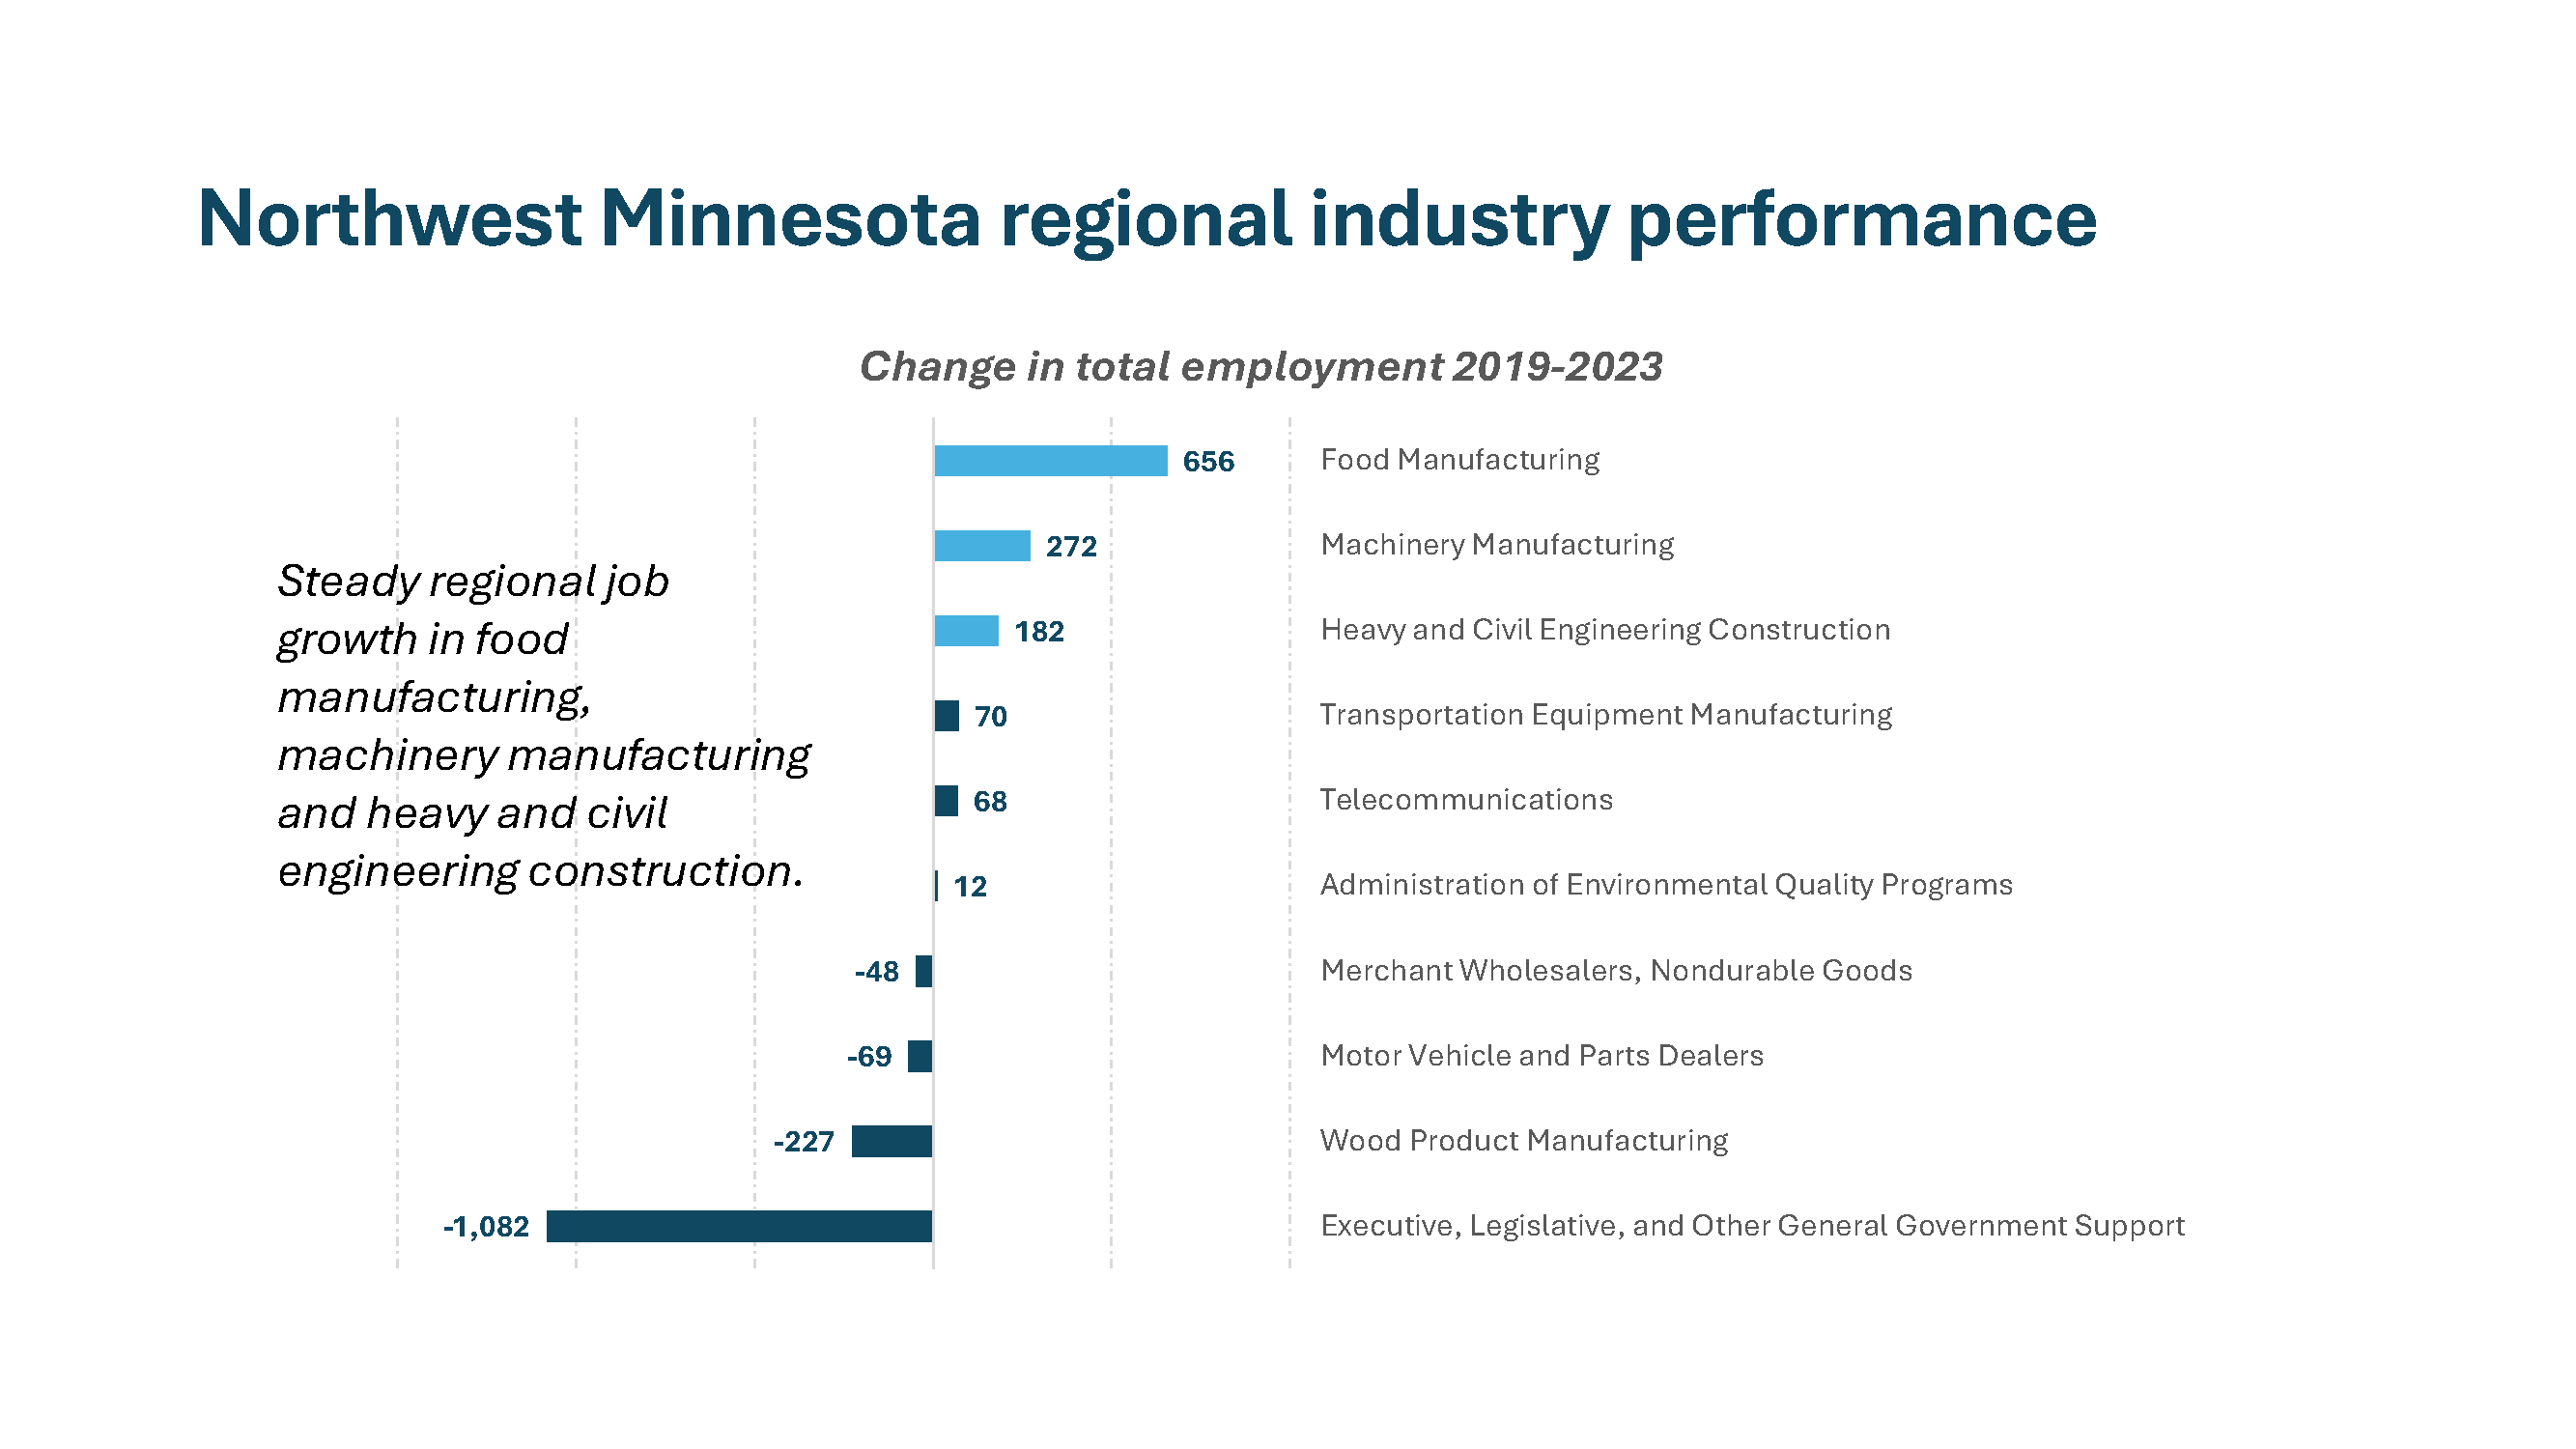
- Northwest Minnesota: Northwest led all regions in growth this decade. From 2019-2023, the region grew total employment by 0.8%, total labor force by 1.6%, total wages by 24% and increased real GDP 1.9% annually from 2019-2022.
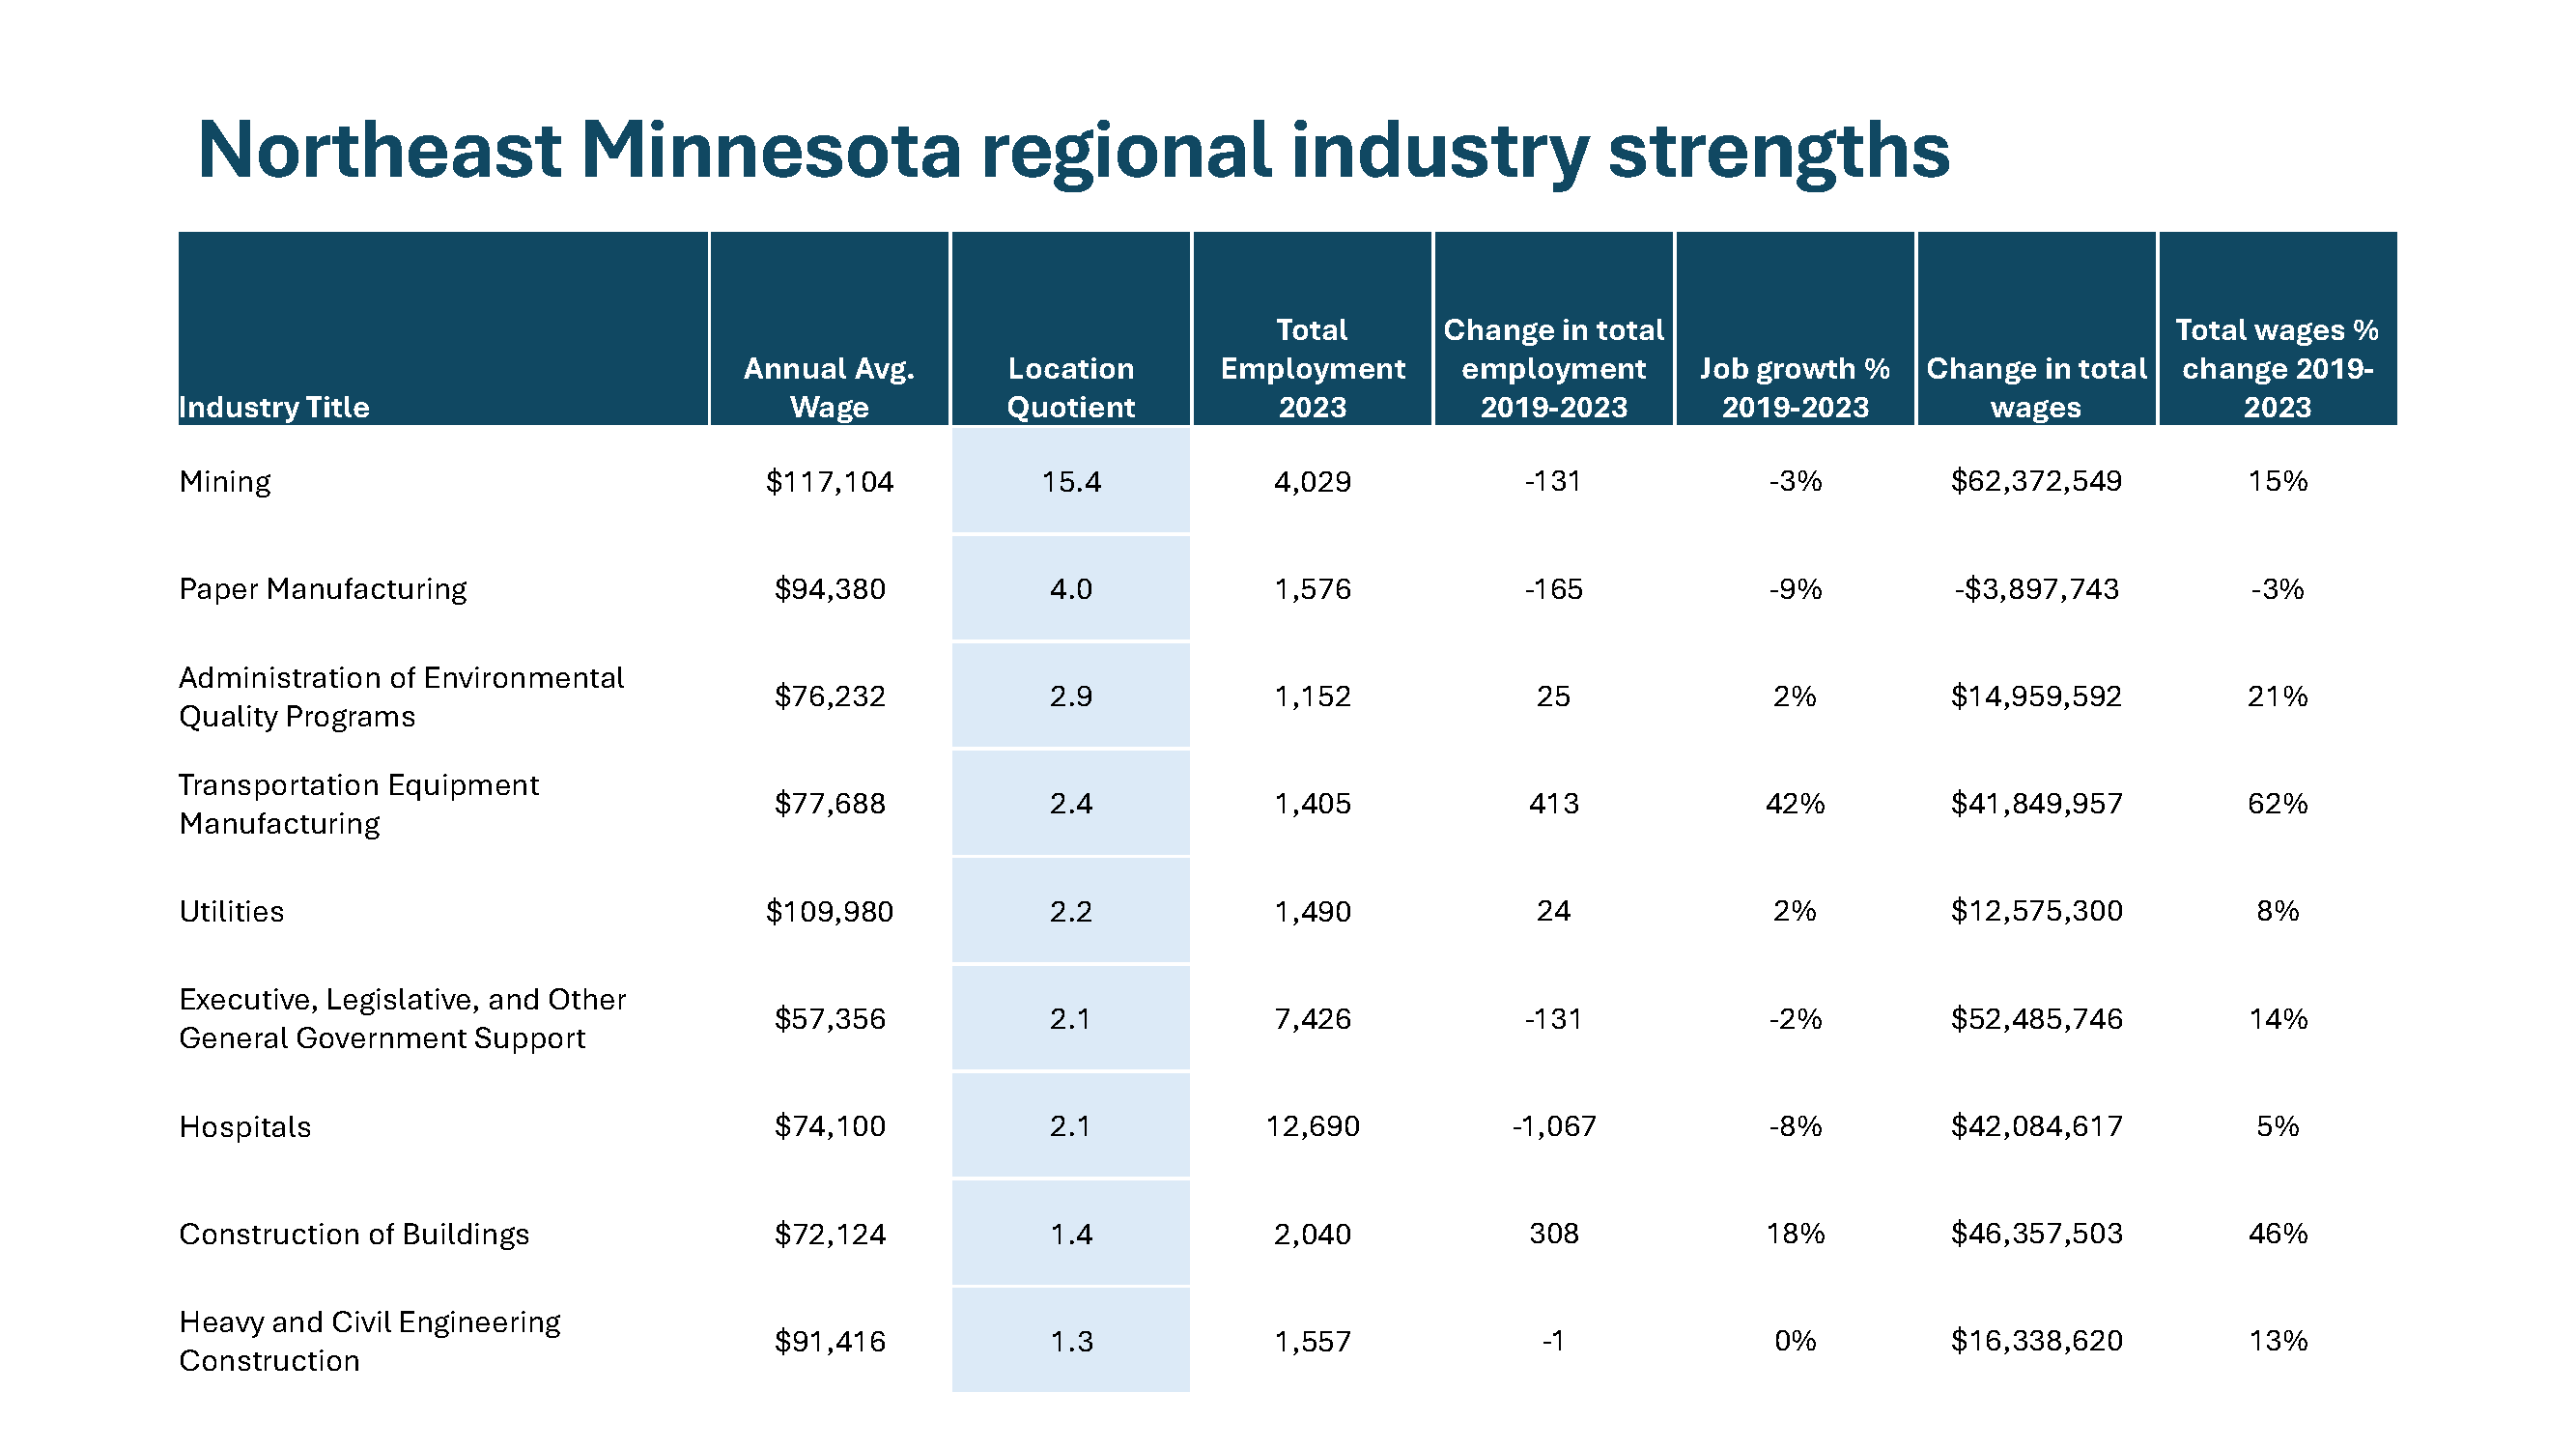
- Northeast Minnesota: In contrast to the Northwestern part of the state, Northeast Minnesota trailed all regions this decade in jobs, labor force, wages and GDP. Health care was the most heavily impacted sector, shedding nearly 2,000 jobs since 2019.
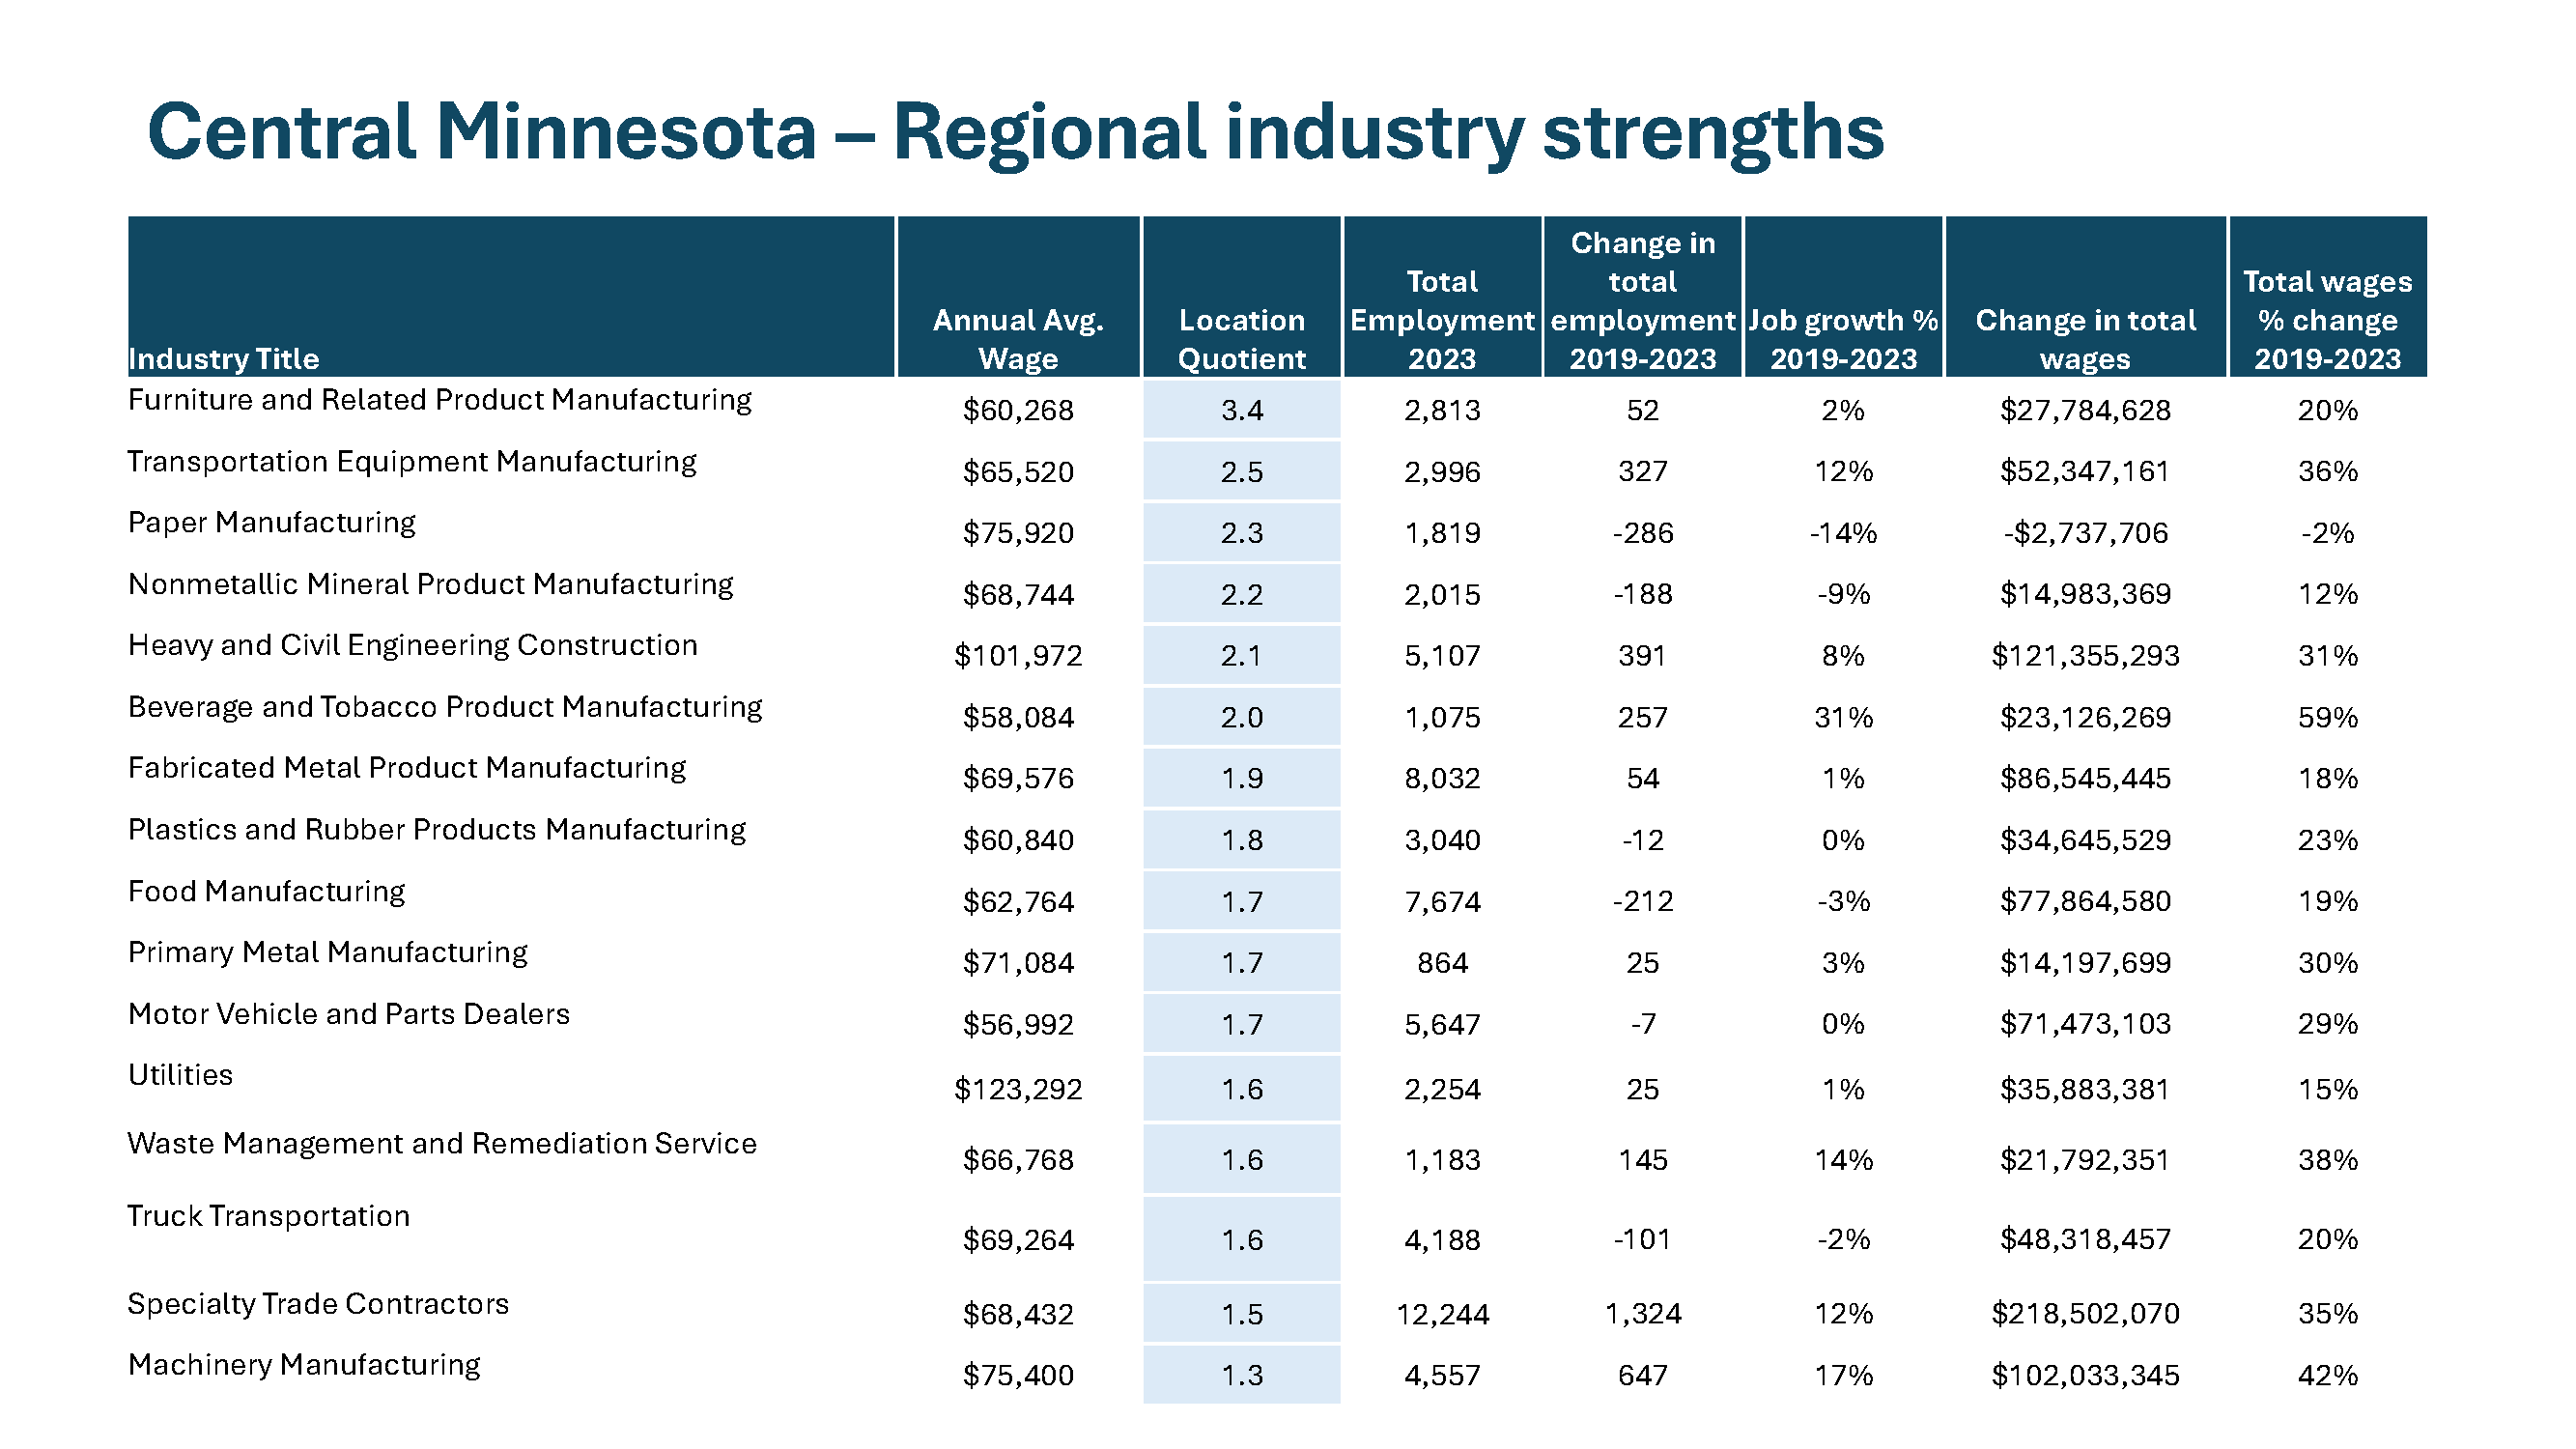
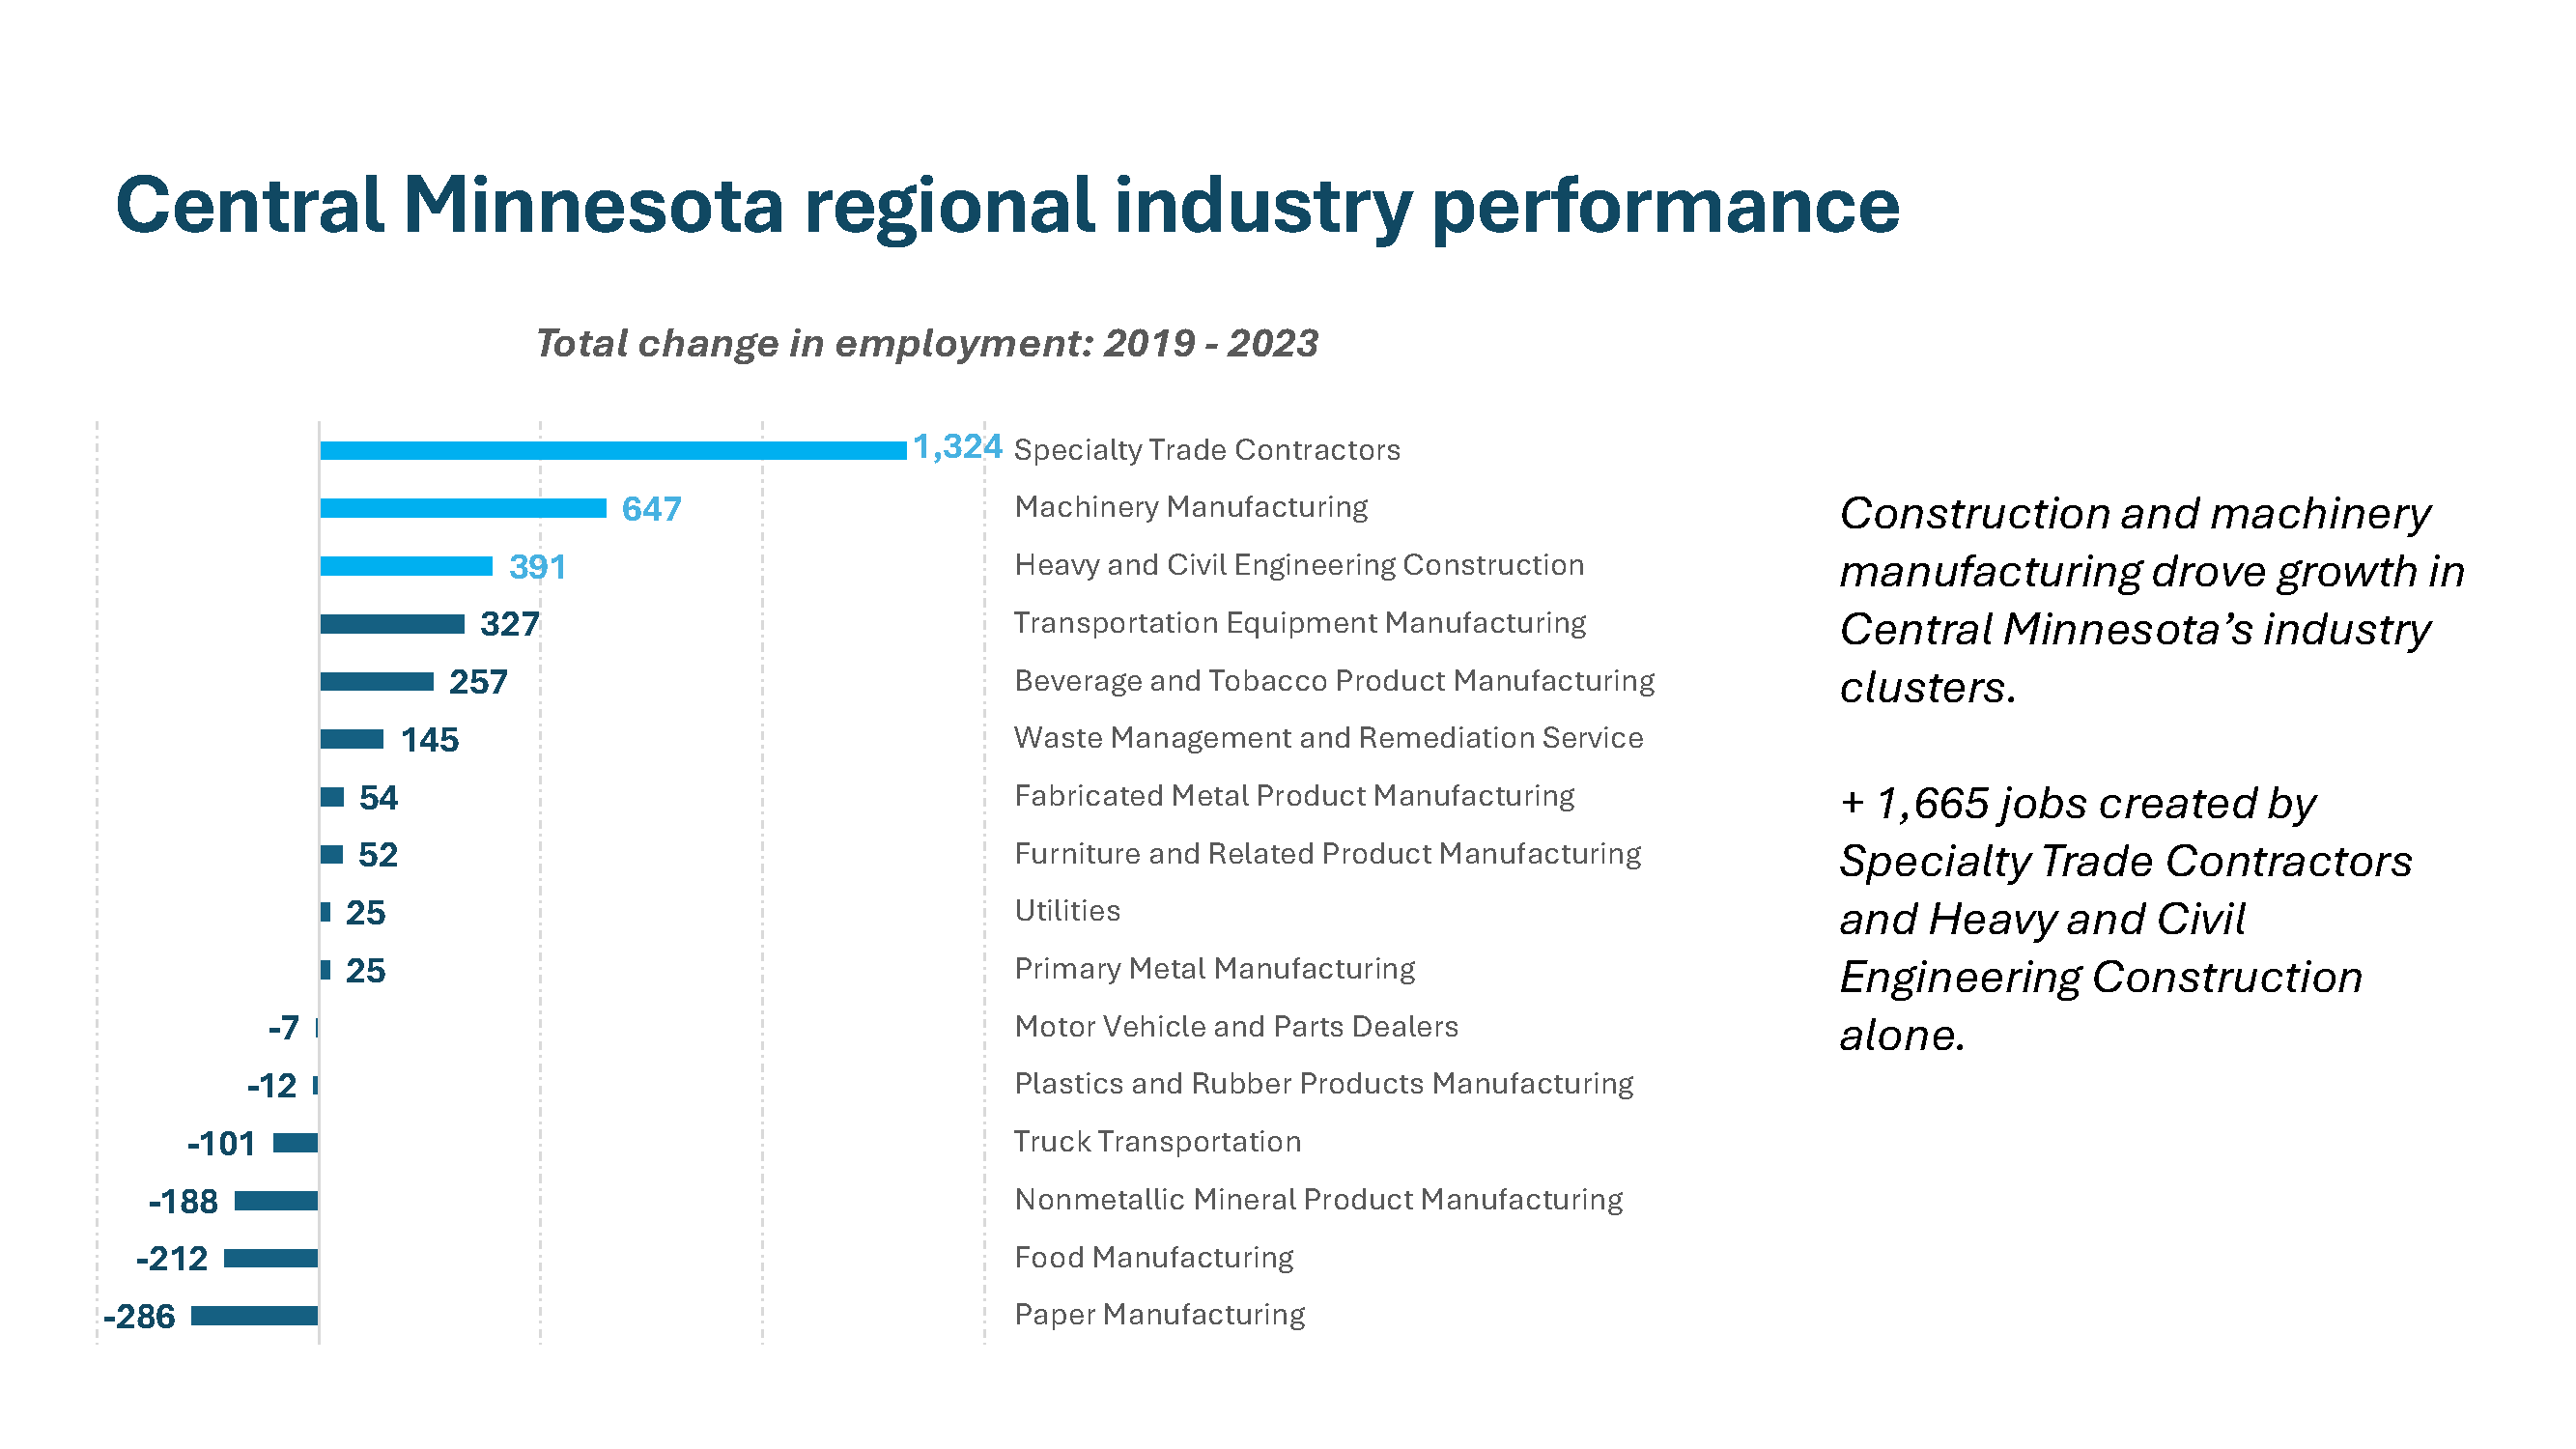
- Central Minnesota: The Central region was the only other region besides Northwest that had more jobs in 2023 than in 2019, driven by strong construction activity in the region. Central Minnesota increased total employment by 0.3% even as its total available labor force declined by 0.6% in that time.
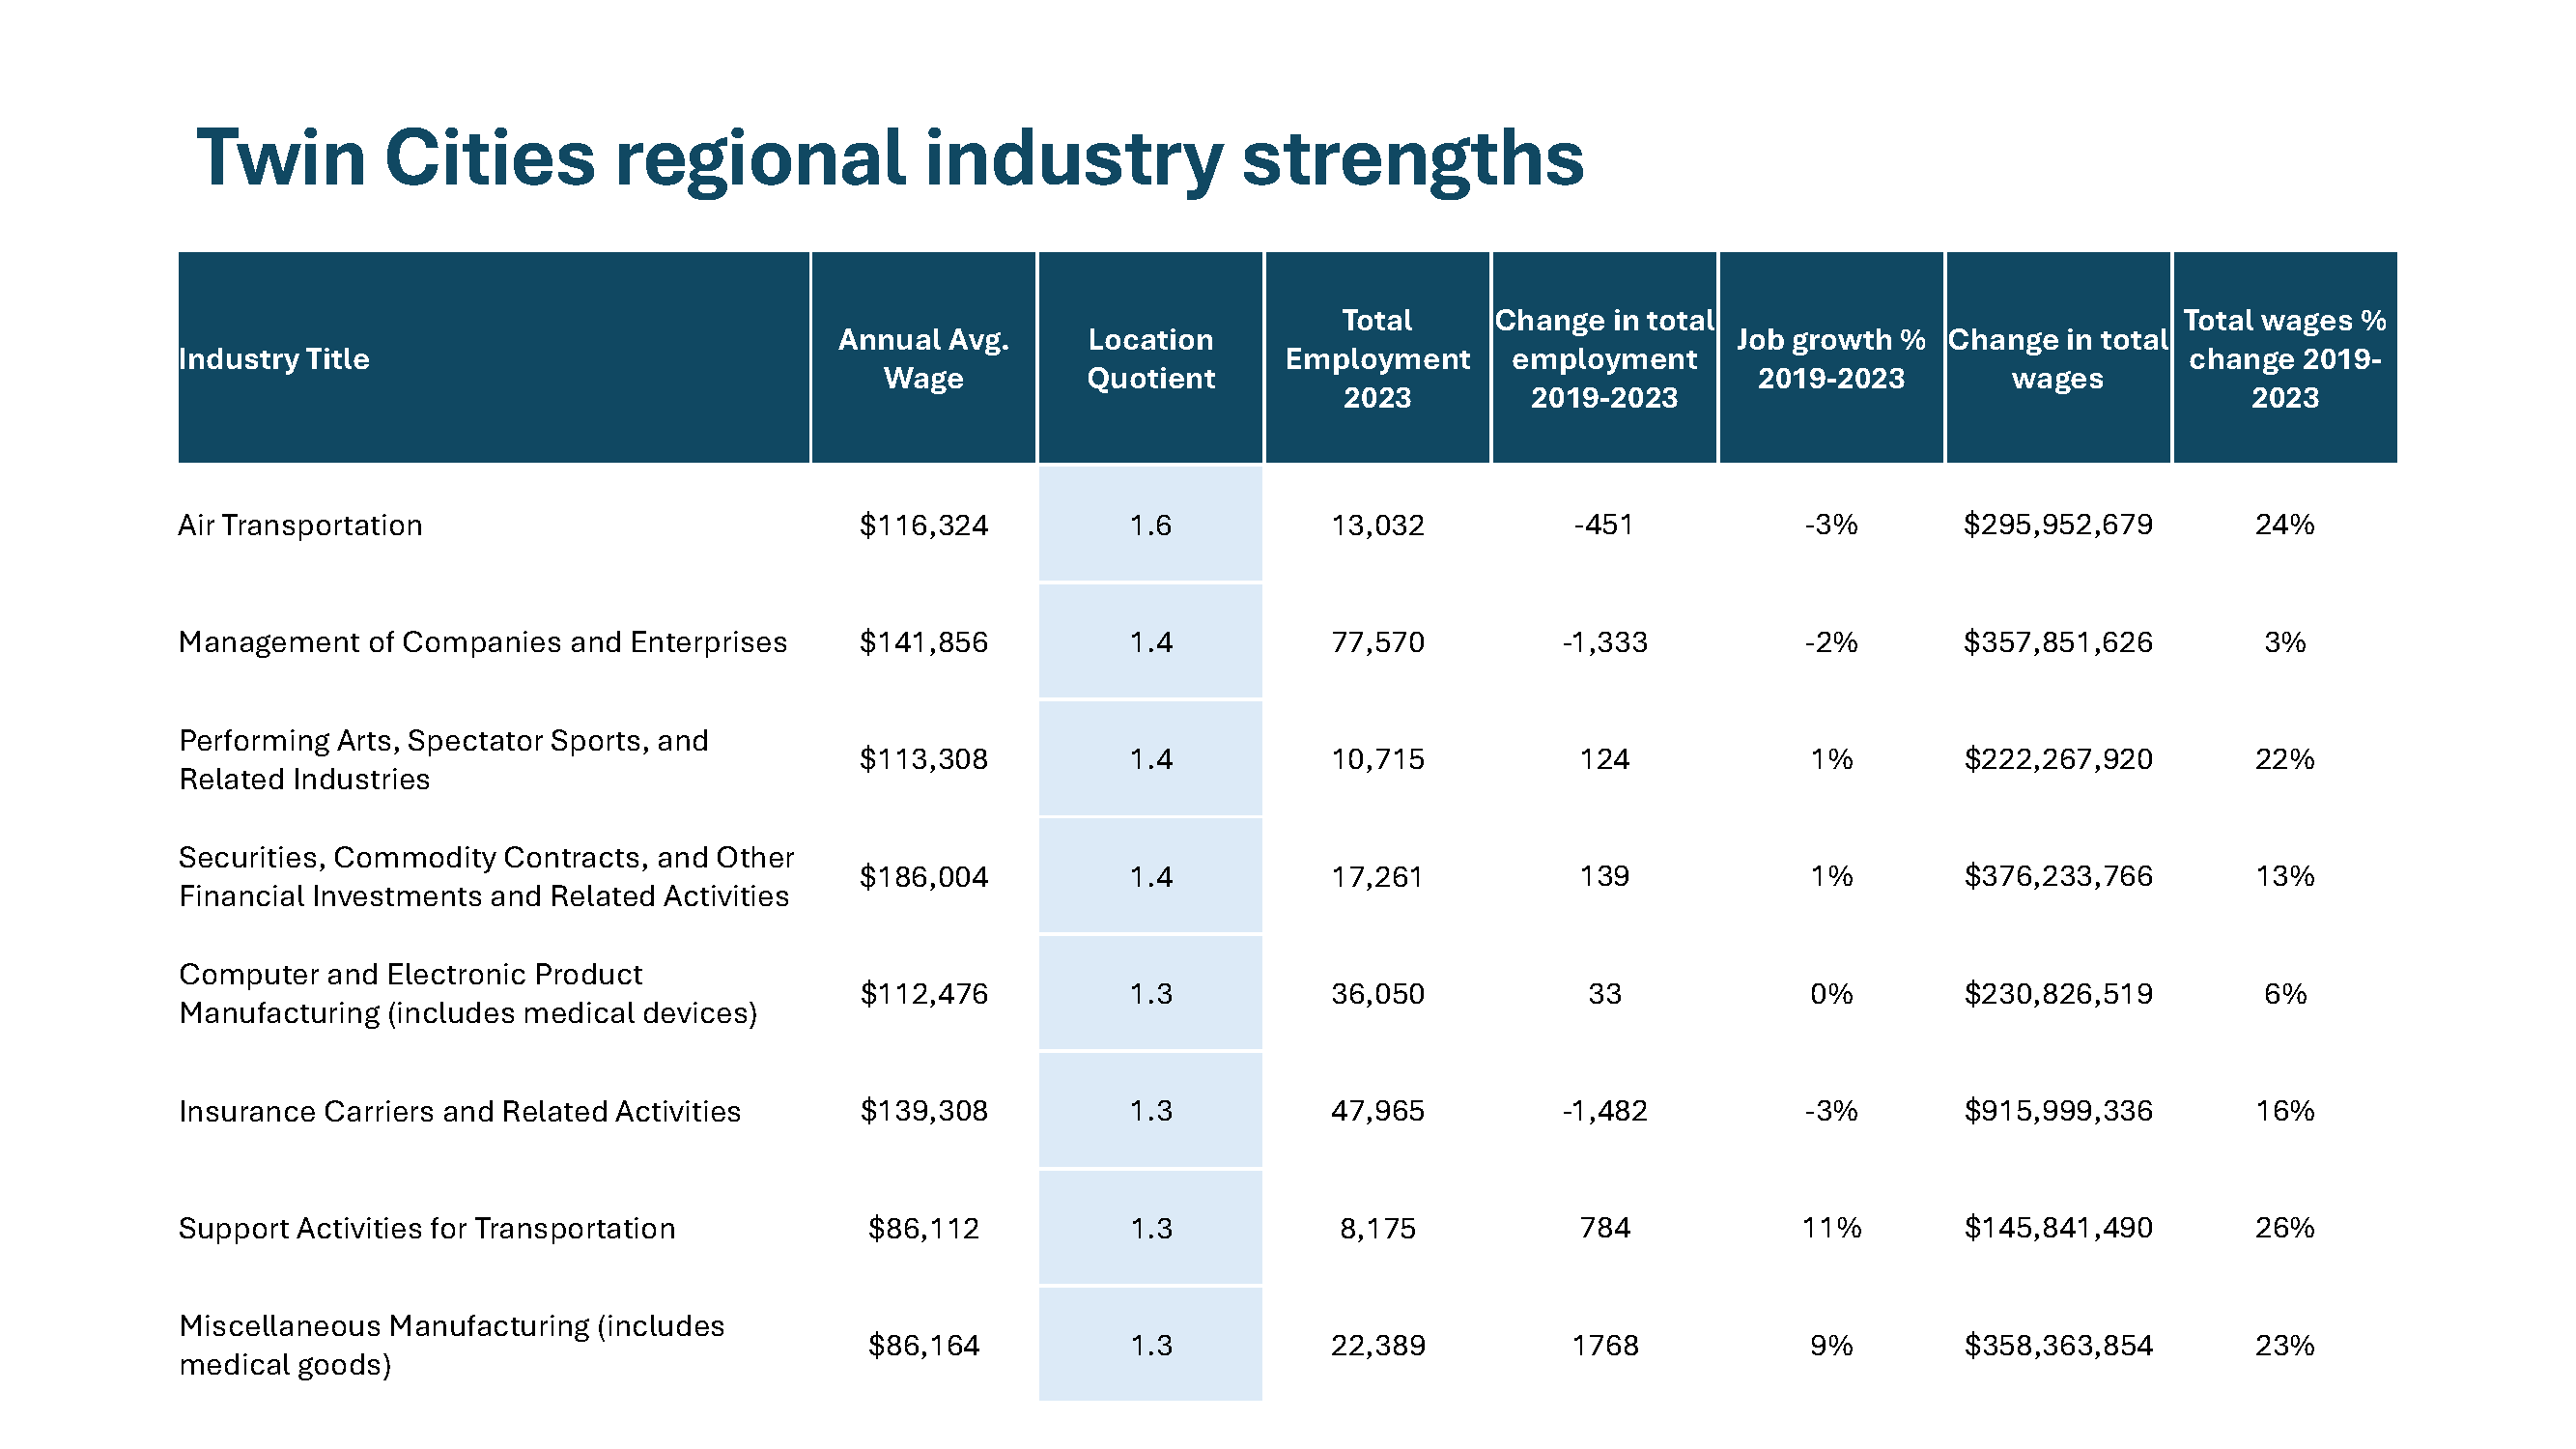
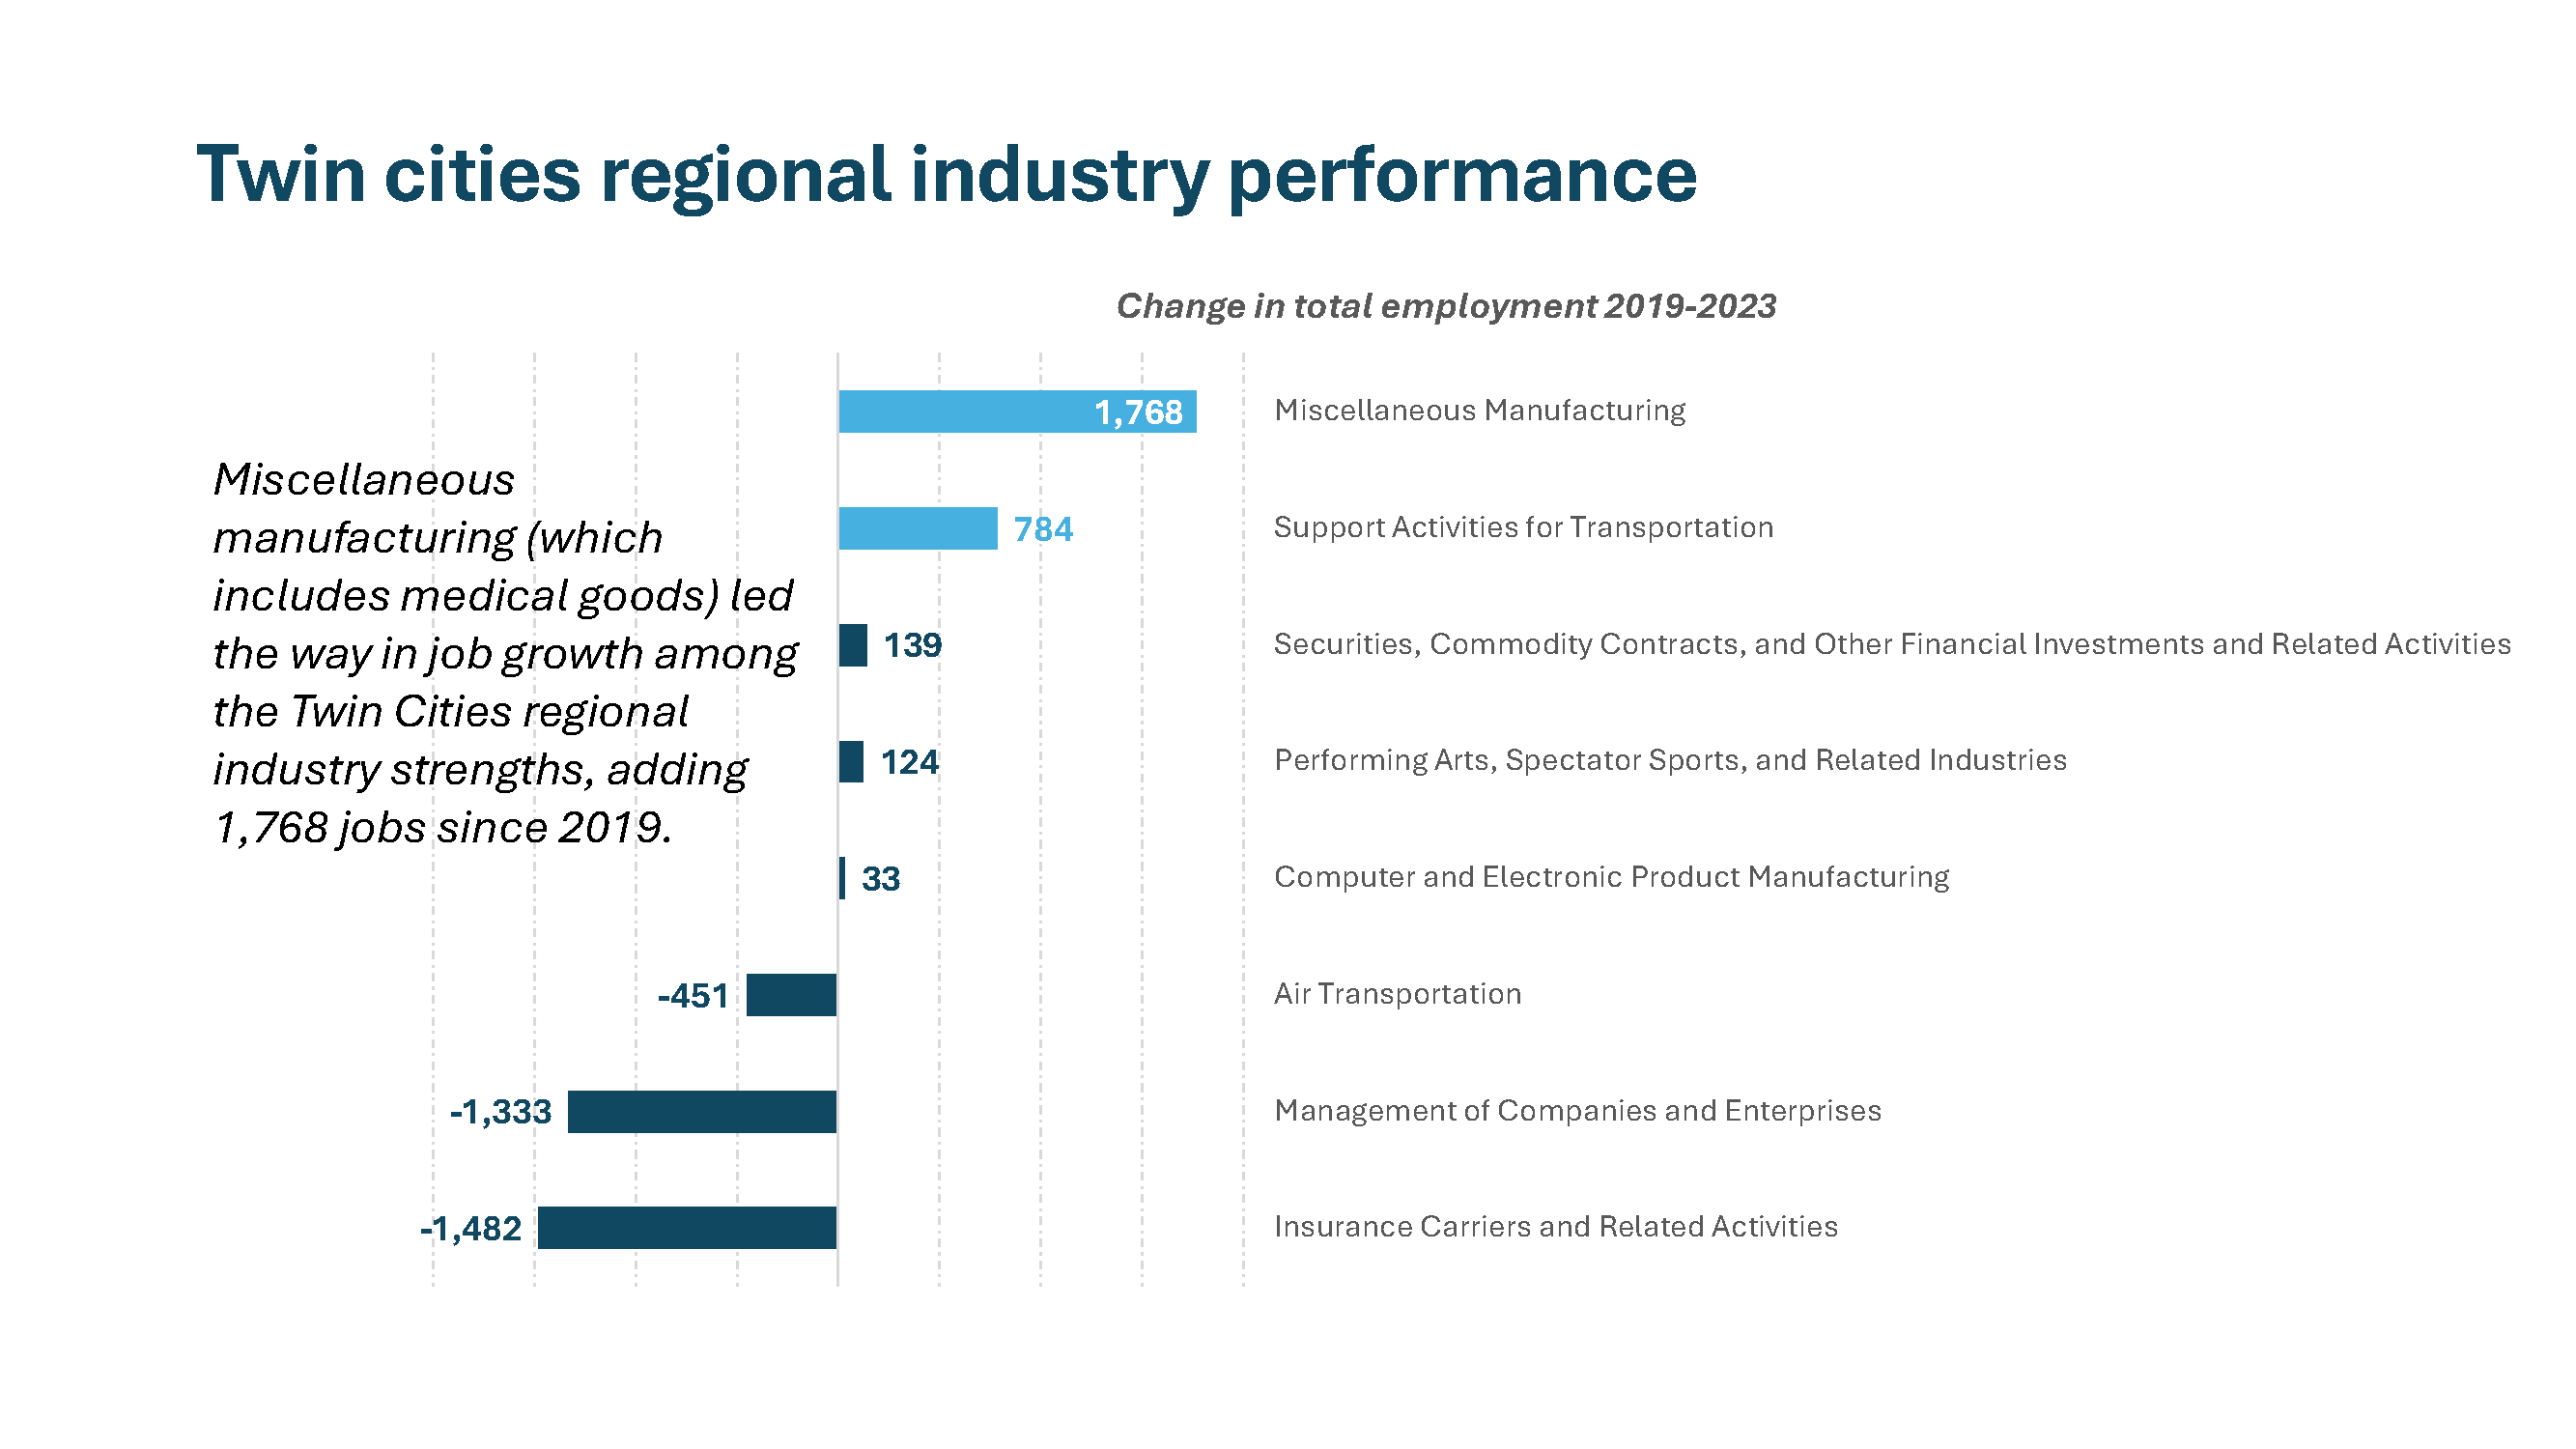
- Twin Cities: The Twin Cities metro had mixed results. The region had the second largest decline in the 2020 downturn and had fewer total jobs in 2023 than in 2019. However, GDP bounced back faster than most other regions in the state and had a robust recovery in the health care sector, adding over 12,000 jobs since 2019.
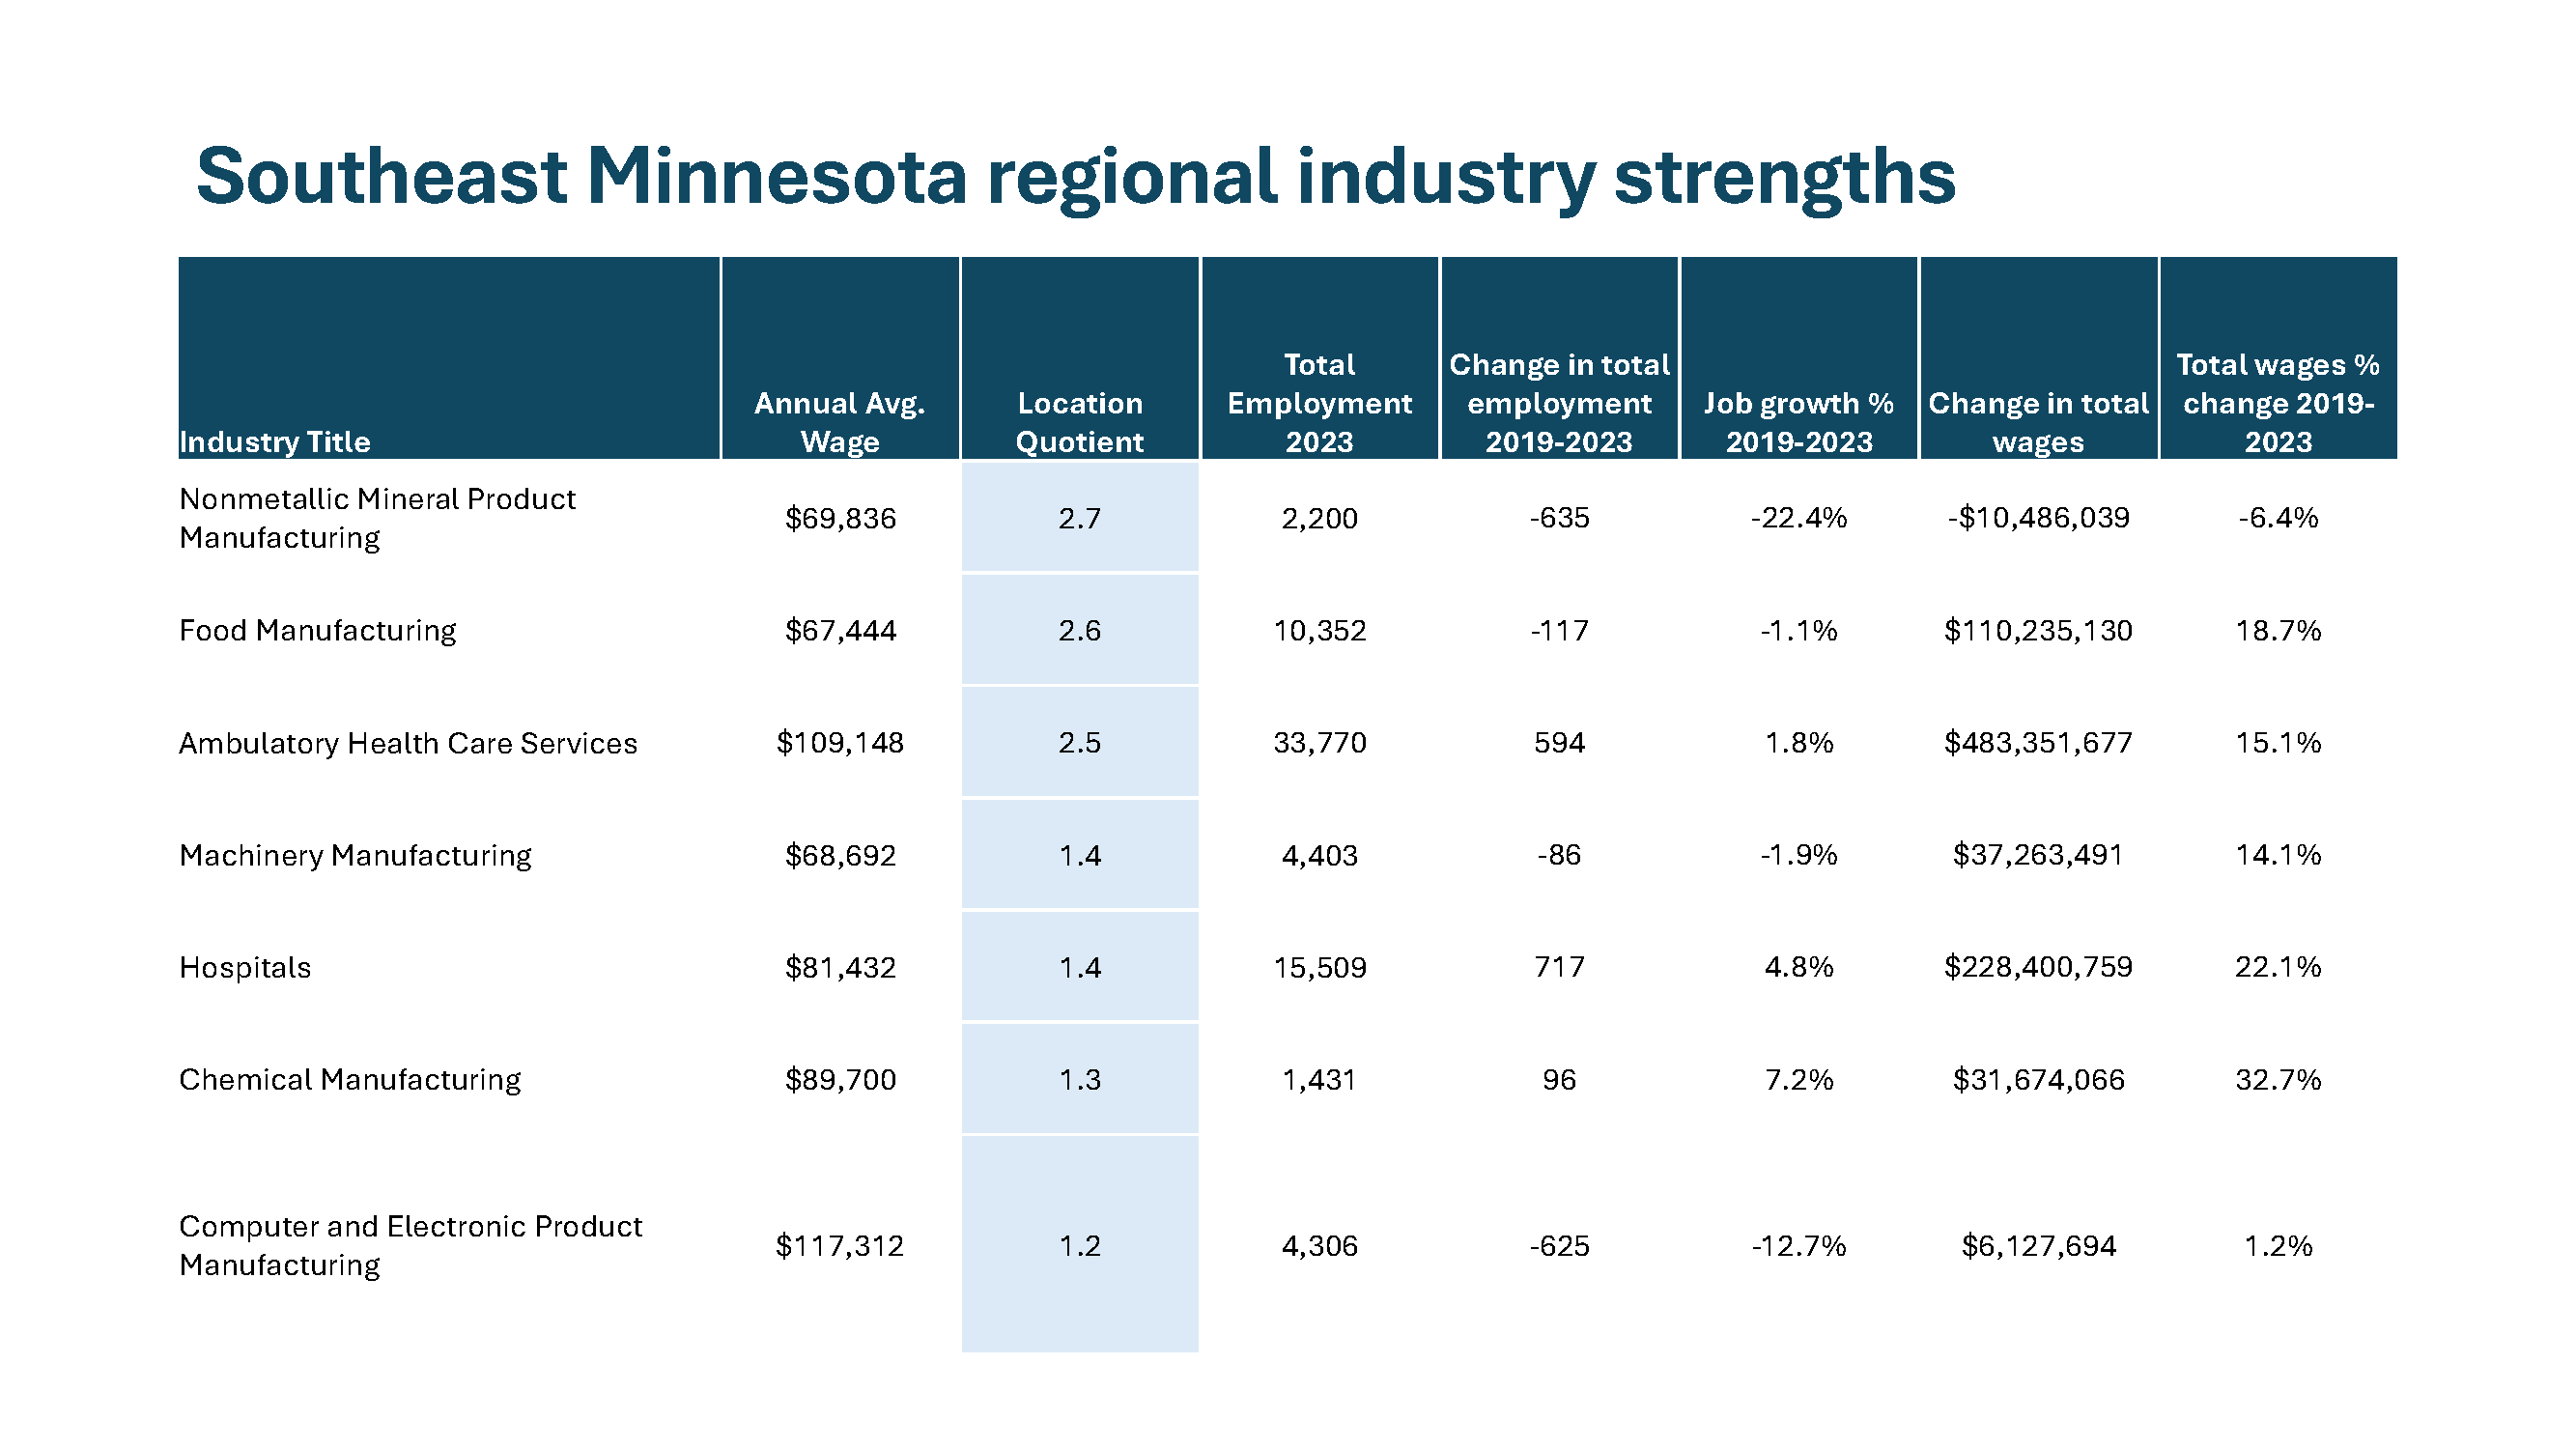
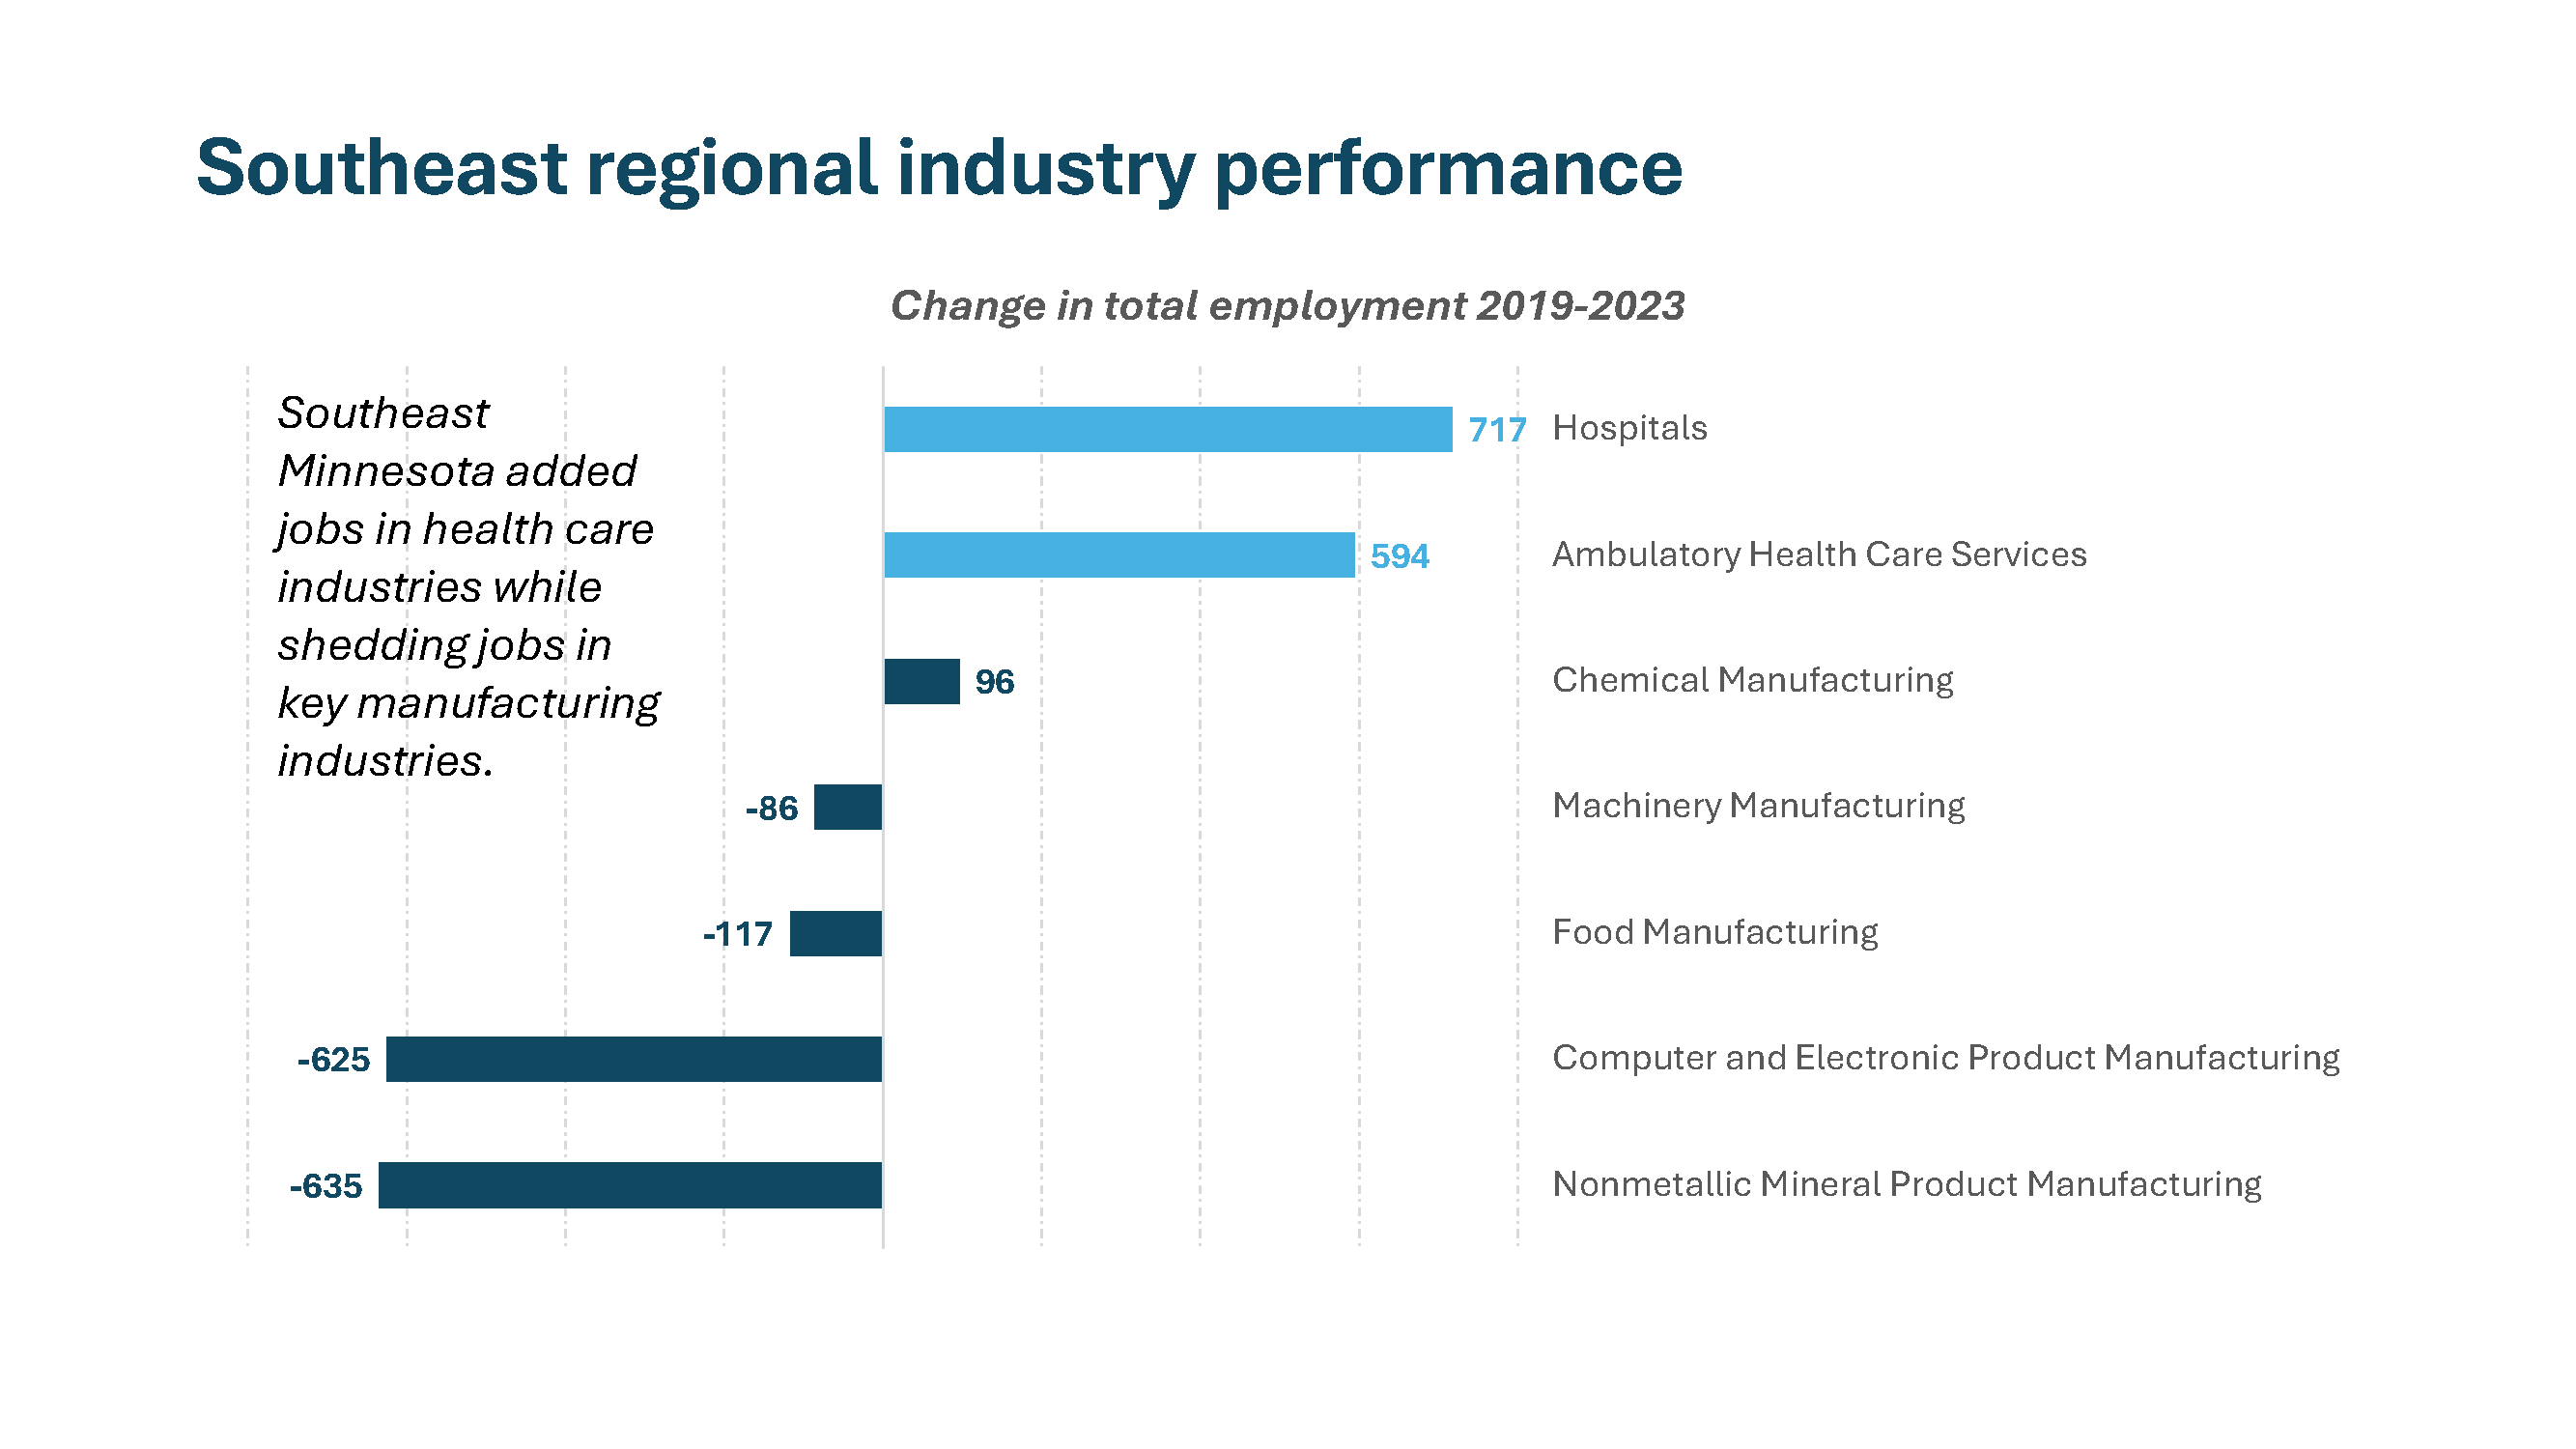
- Southeast Minnesota: The Southeast region of the state was one of only two regions that had more people in the labor force in 2023 than 2019. However, despite a growing workforce, the region’s total number of jobs declined slightly in that time. The region’s manufacturing sector was the hardest hit, losing over 2,300 jobs.
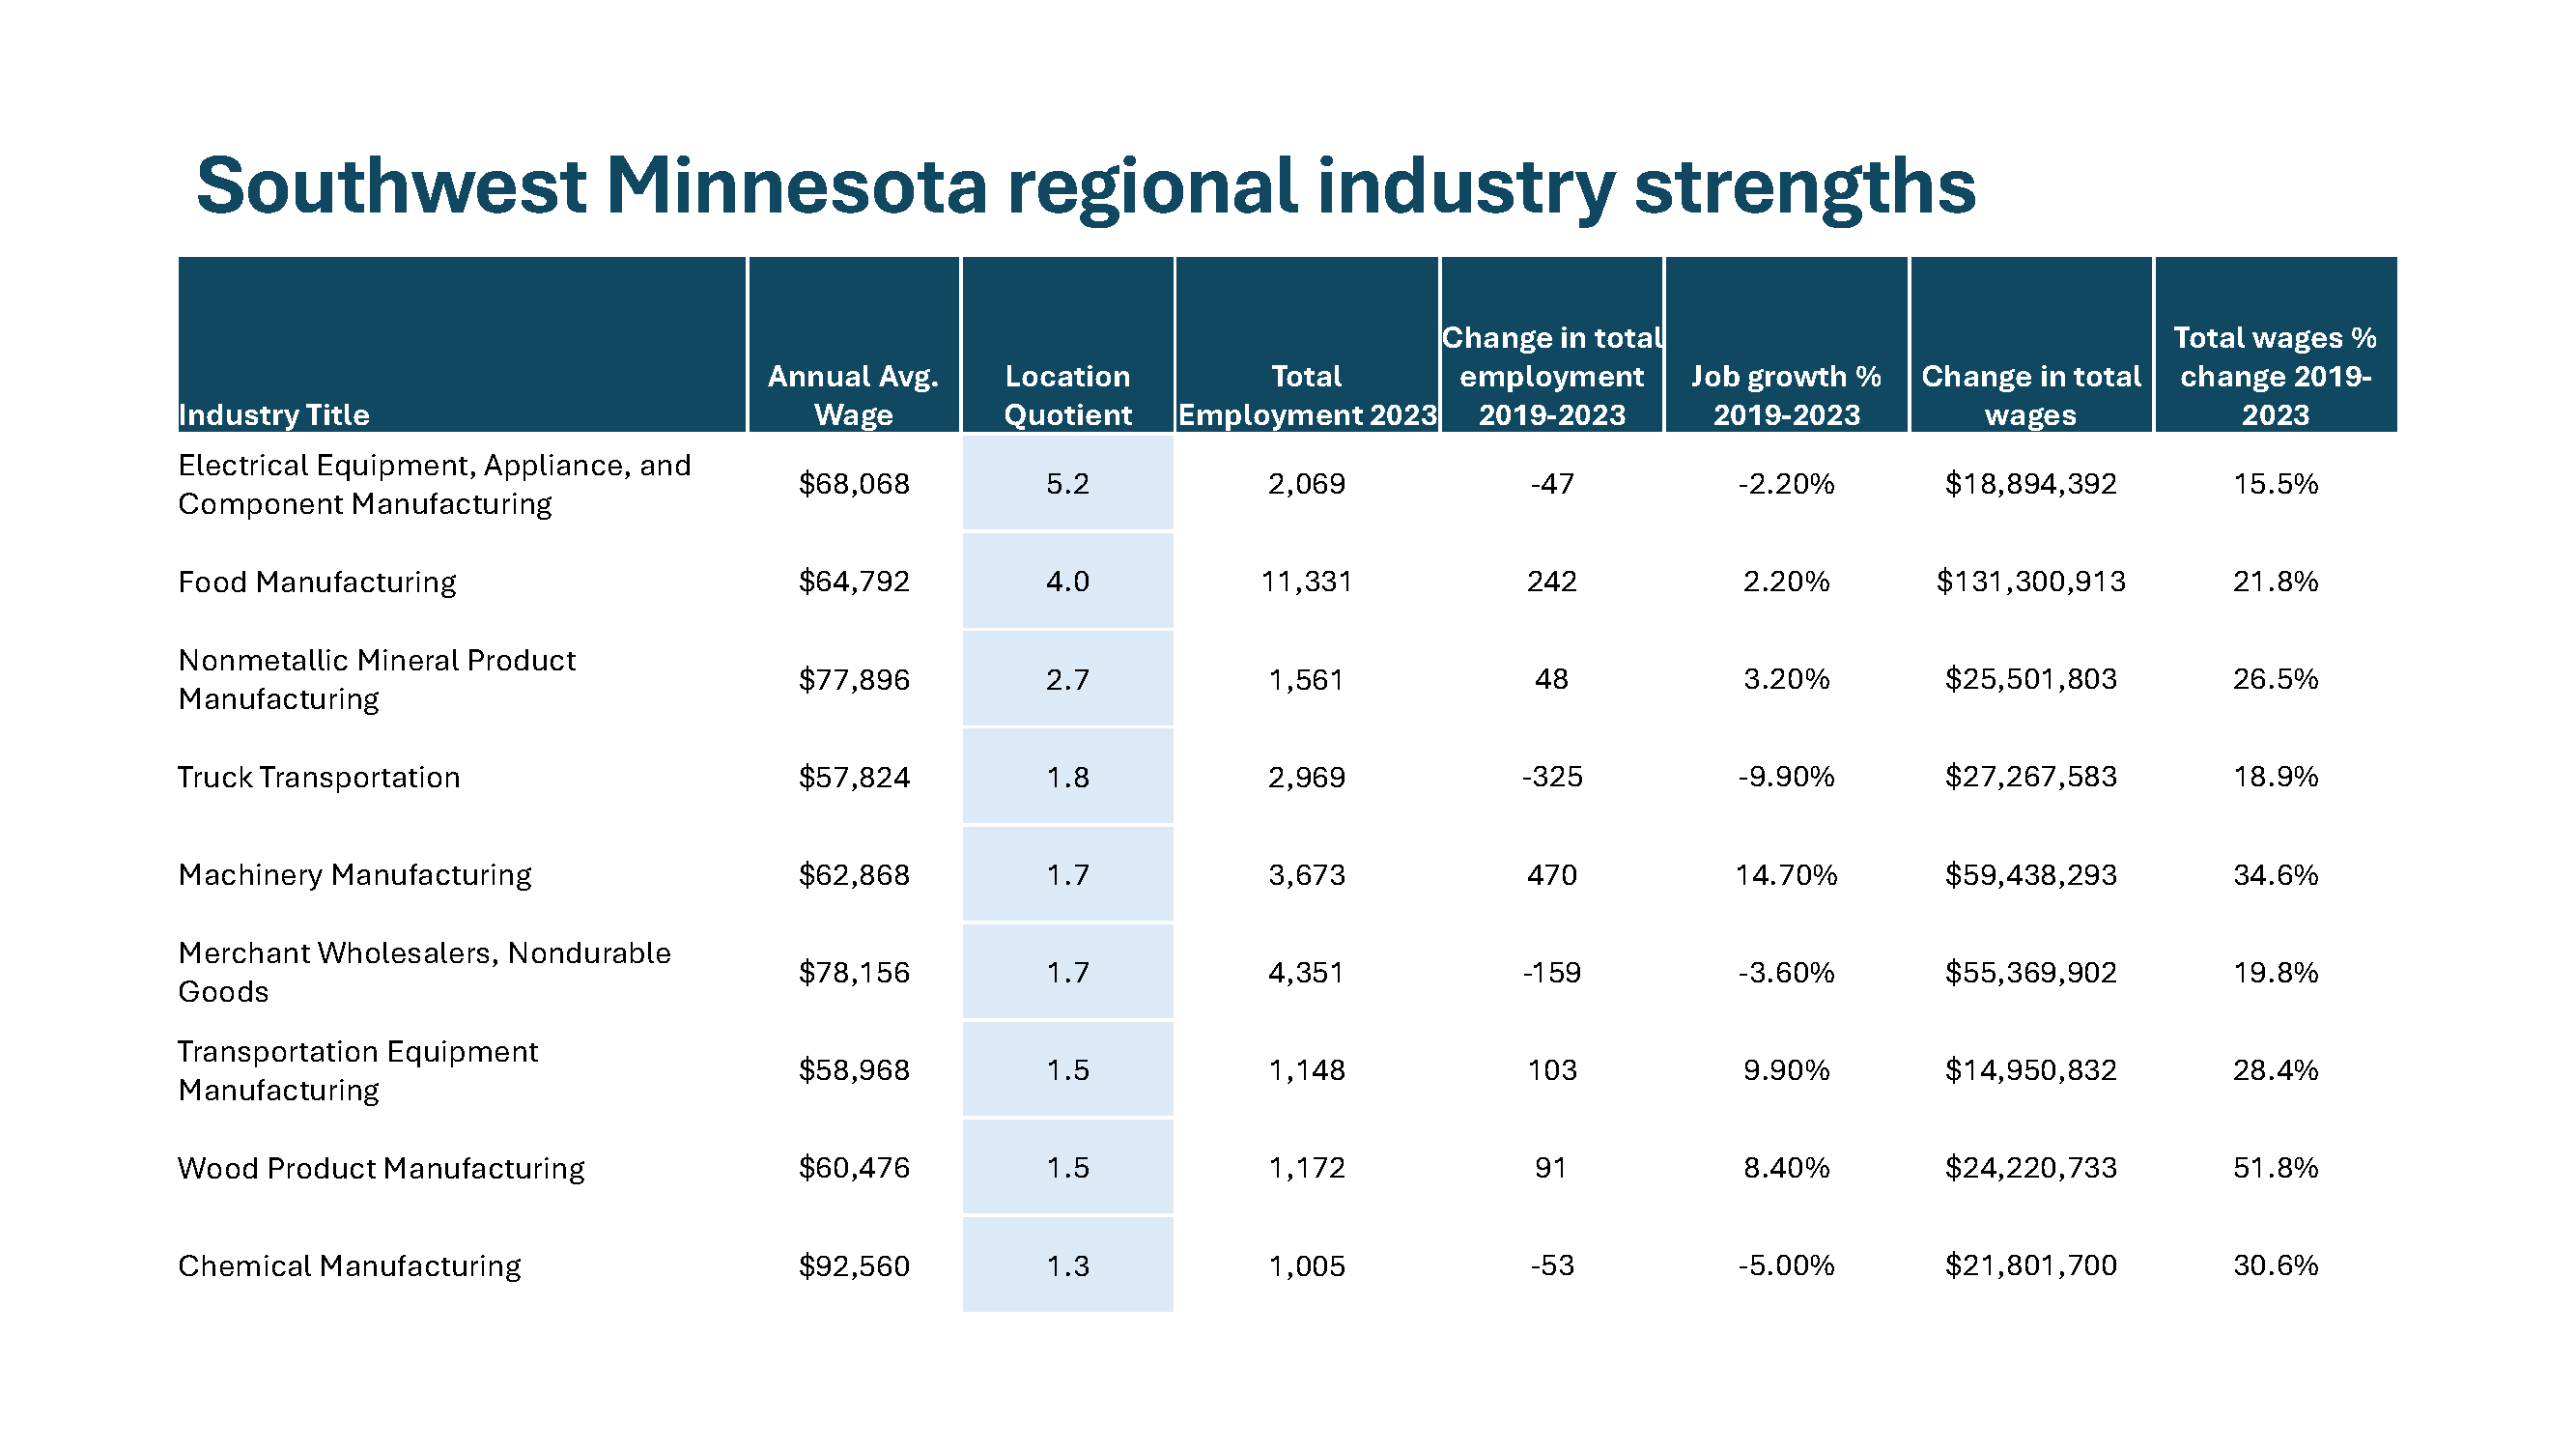
- Southwest Minnesota: Total employment declined by 2.1% in the region and its available labor force shrank by 1.6%. However, total wages paid in the region increased by 19% despite few jobs and workers in that time.
- Low unemployment and tight labor markets: Like the state as a whole, slow economic recovery and growth in Minnesota’s region’s is explained in part by declines in labor availability. However, this may not offer a complete explanation. For example, Southeast Minnesota grew the size of its labor force but had declines in total employment. And Northeast Minnesota had the largest decline in its available labor force but had the highest unemployment rate. Other factors related to economic competitiveness, industry mix and overall business growth may play a role in explaining regional performance.
- Construction sector drove growth in most regional economies from 2019-2023: The construction sector was the leading contributor to job gains in three regions (Northeast, Northwest and Central Minnesota). It was the second leading industry in the Twin Cities and the fifth leading in Southeast. Only Southwest Minnesota had negative job growth in construction this decade.
- Regions differed in sectors with the largest job losses: While there was a similar trend in industry leaders across regions, regions differed in which industries contributed the most to job losses. Health care and social assistance was the worst performing sector in two regions (Northeast and Southwest) but the top performing sector in the Twin Cities. Management of companies and enterprises (e.g. company headquarters) led job gains Southeast but led job losses in Central Minnesota and declined significantly in the Twin Cities as well. These differences highlight the importance of looking beneath statewide data to see how the same sector may vary significantly by region.
Are Minnesota’s regions building on their key industry strengths?
Minnesota is known for its diverse industry strengths: health care and med-tech, food and agriculture, iron ore mining, corporate headquarters, recreational vehicles, windows, the list goes on. While some of these industries are spread throughout Minnesota, many of them are concentrated in specific regions within state, having an outsized impact on their local and regional economies.
Sustaining and building on these strengths is an important element of economic development within the state’s regions. This section looks at the recent performance of Minnesota’s distinct regional industry clusters.
We analyzed industries at the three-digit NAICS level and identified regional strengths as those industries that had:
- A high concentration of employment relative to the U.S. economy. To make the list, the industry had to have a location quotient of 1.3 or greater. This means that the industry is at least 30% more concentrated in that region than in the national economy.
- Above-average wages compared to the regional economy as-a-whole. This shows that the industry disproportionately contributes income and economic value to the region.
- At least 1,000 total jobs, weeding out very small or niche industries from the analysis.
This is not a perfect selection process. Some industries are left out that could be considered regional strengths. Others are included that might not be as impactful to the region. And using the three-digit NAICS level doesn’t fully capture some detailed industries that are evident only at more detailed levels of analysis. Yet, these criteria strike a balance that provide a useful glimpse of many core industry strengths across Minnesota’s regional economies.
Findings from regional industry analysis:
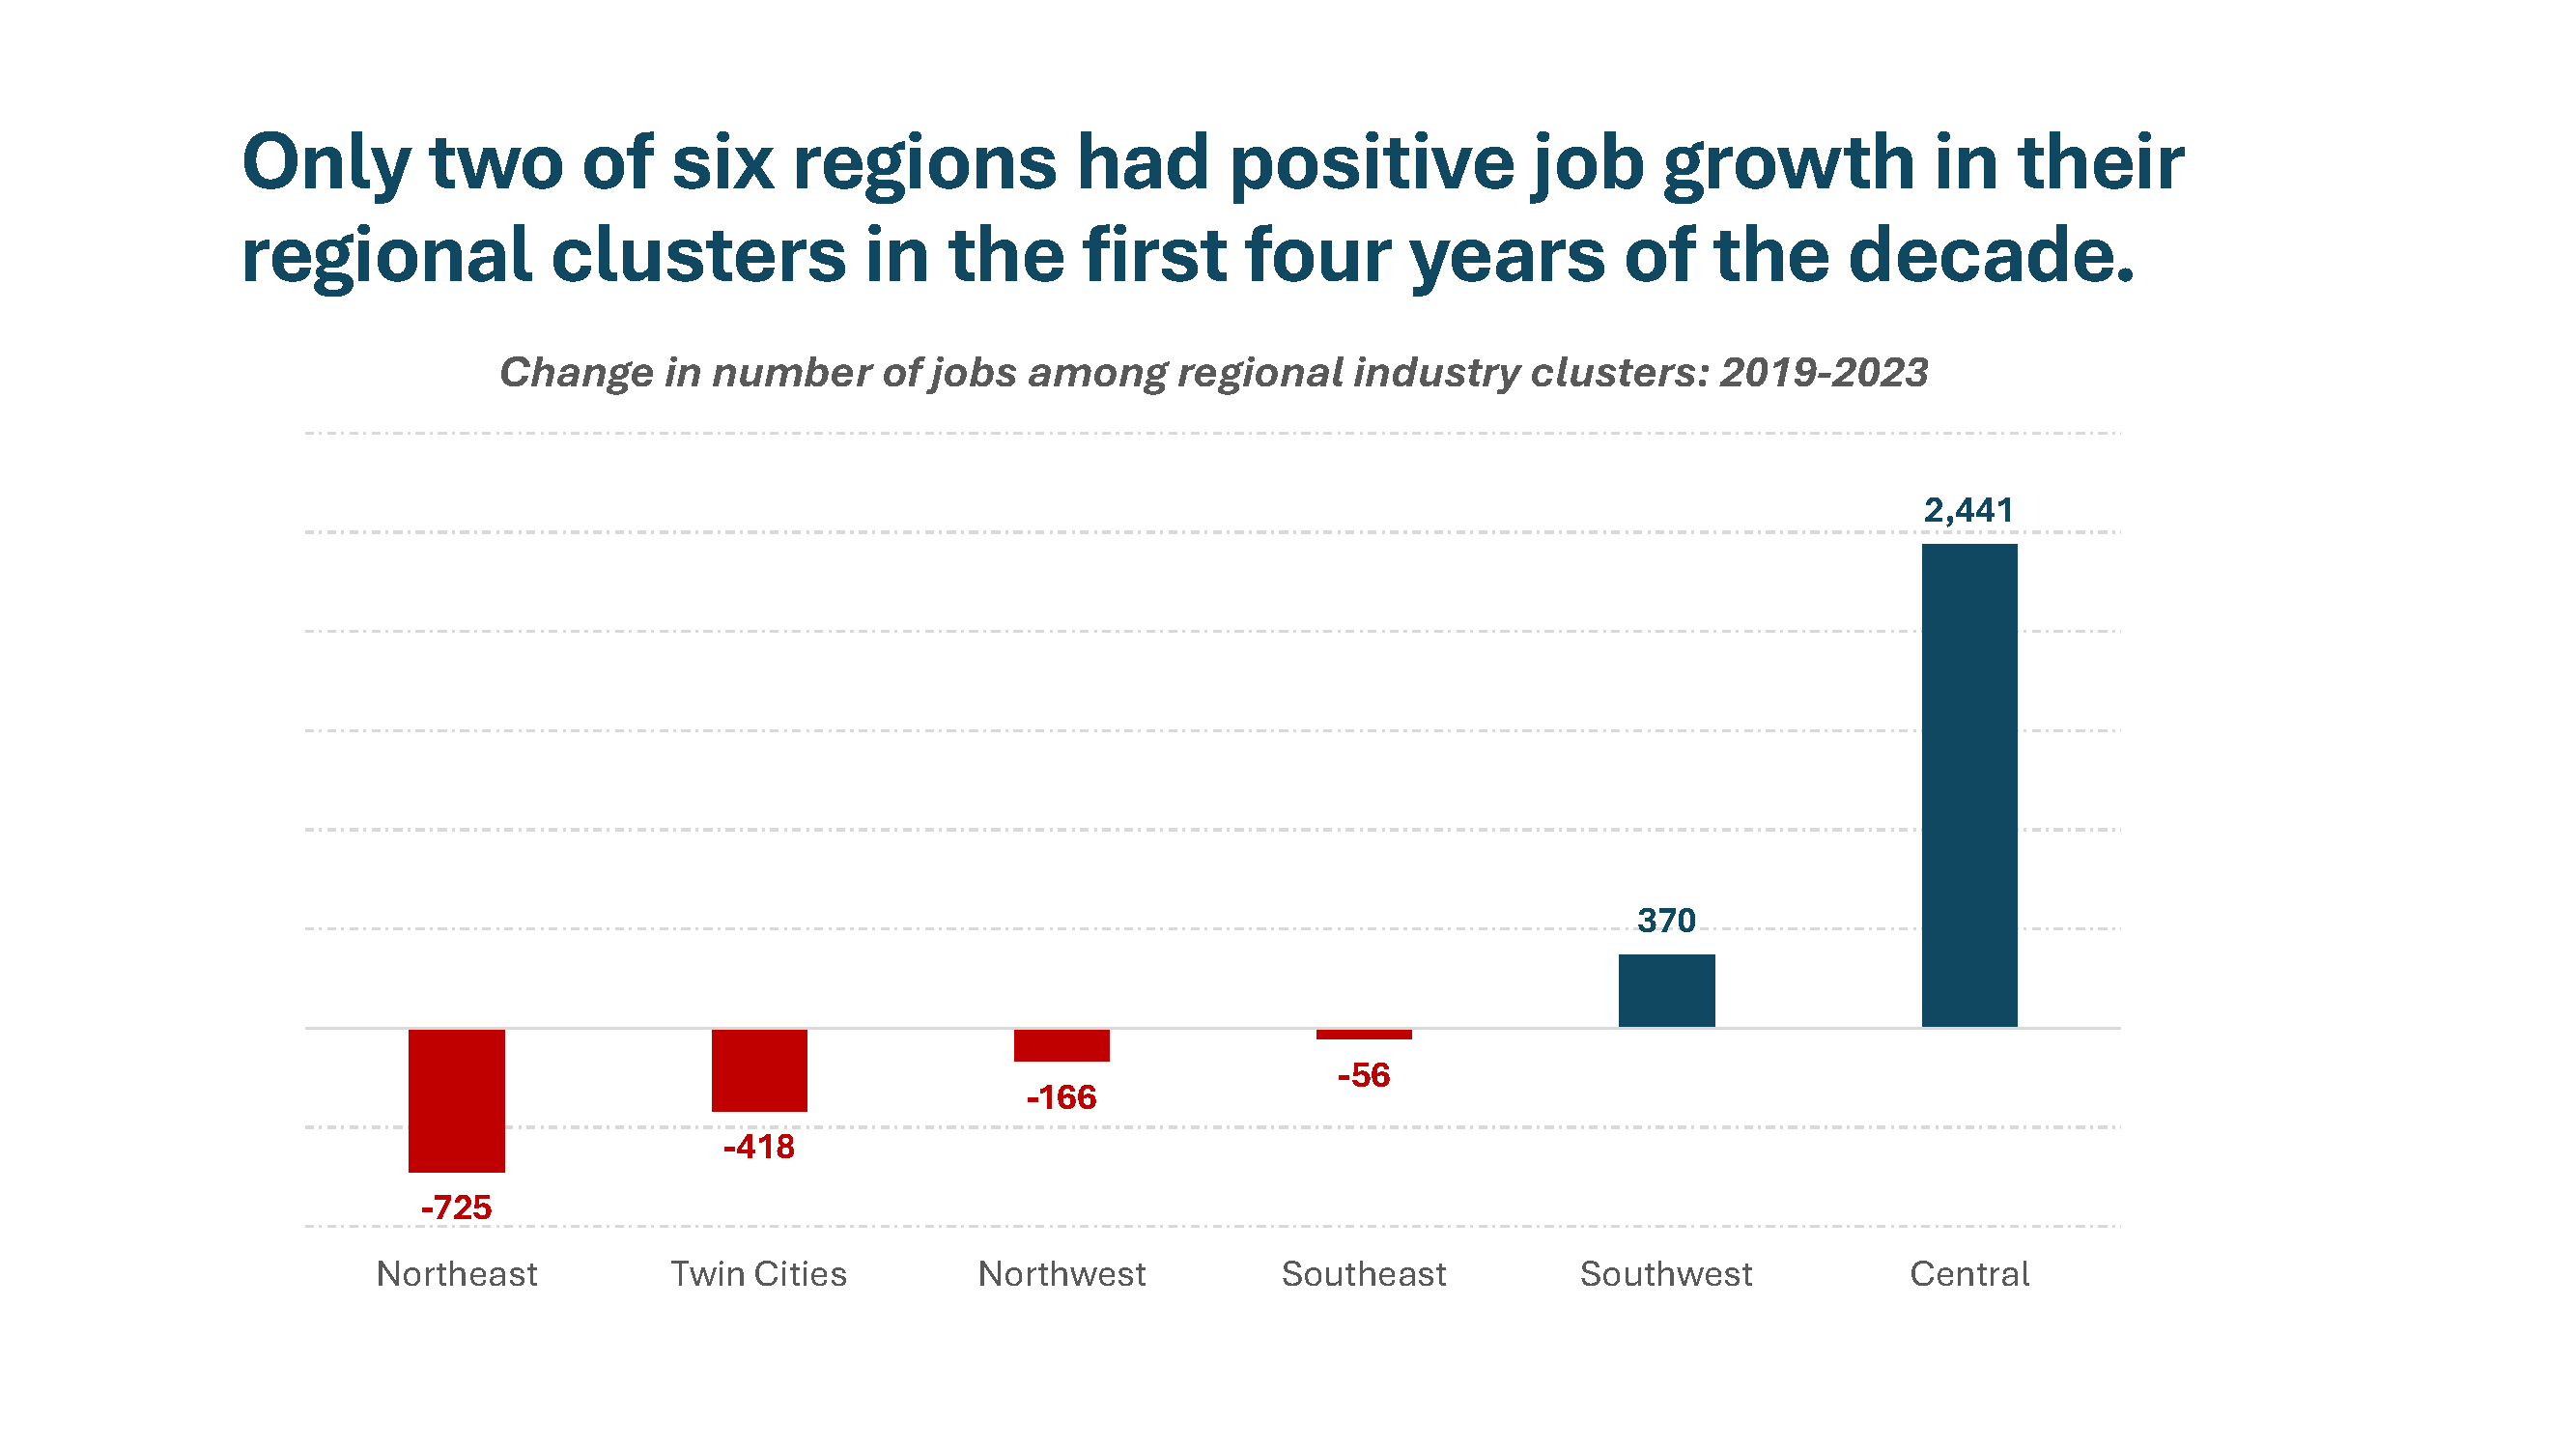
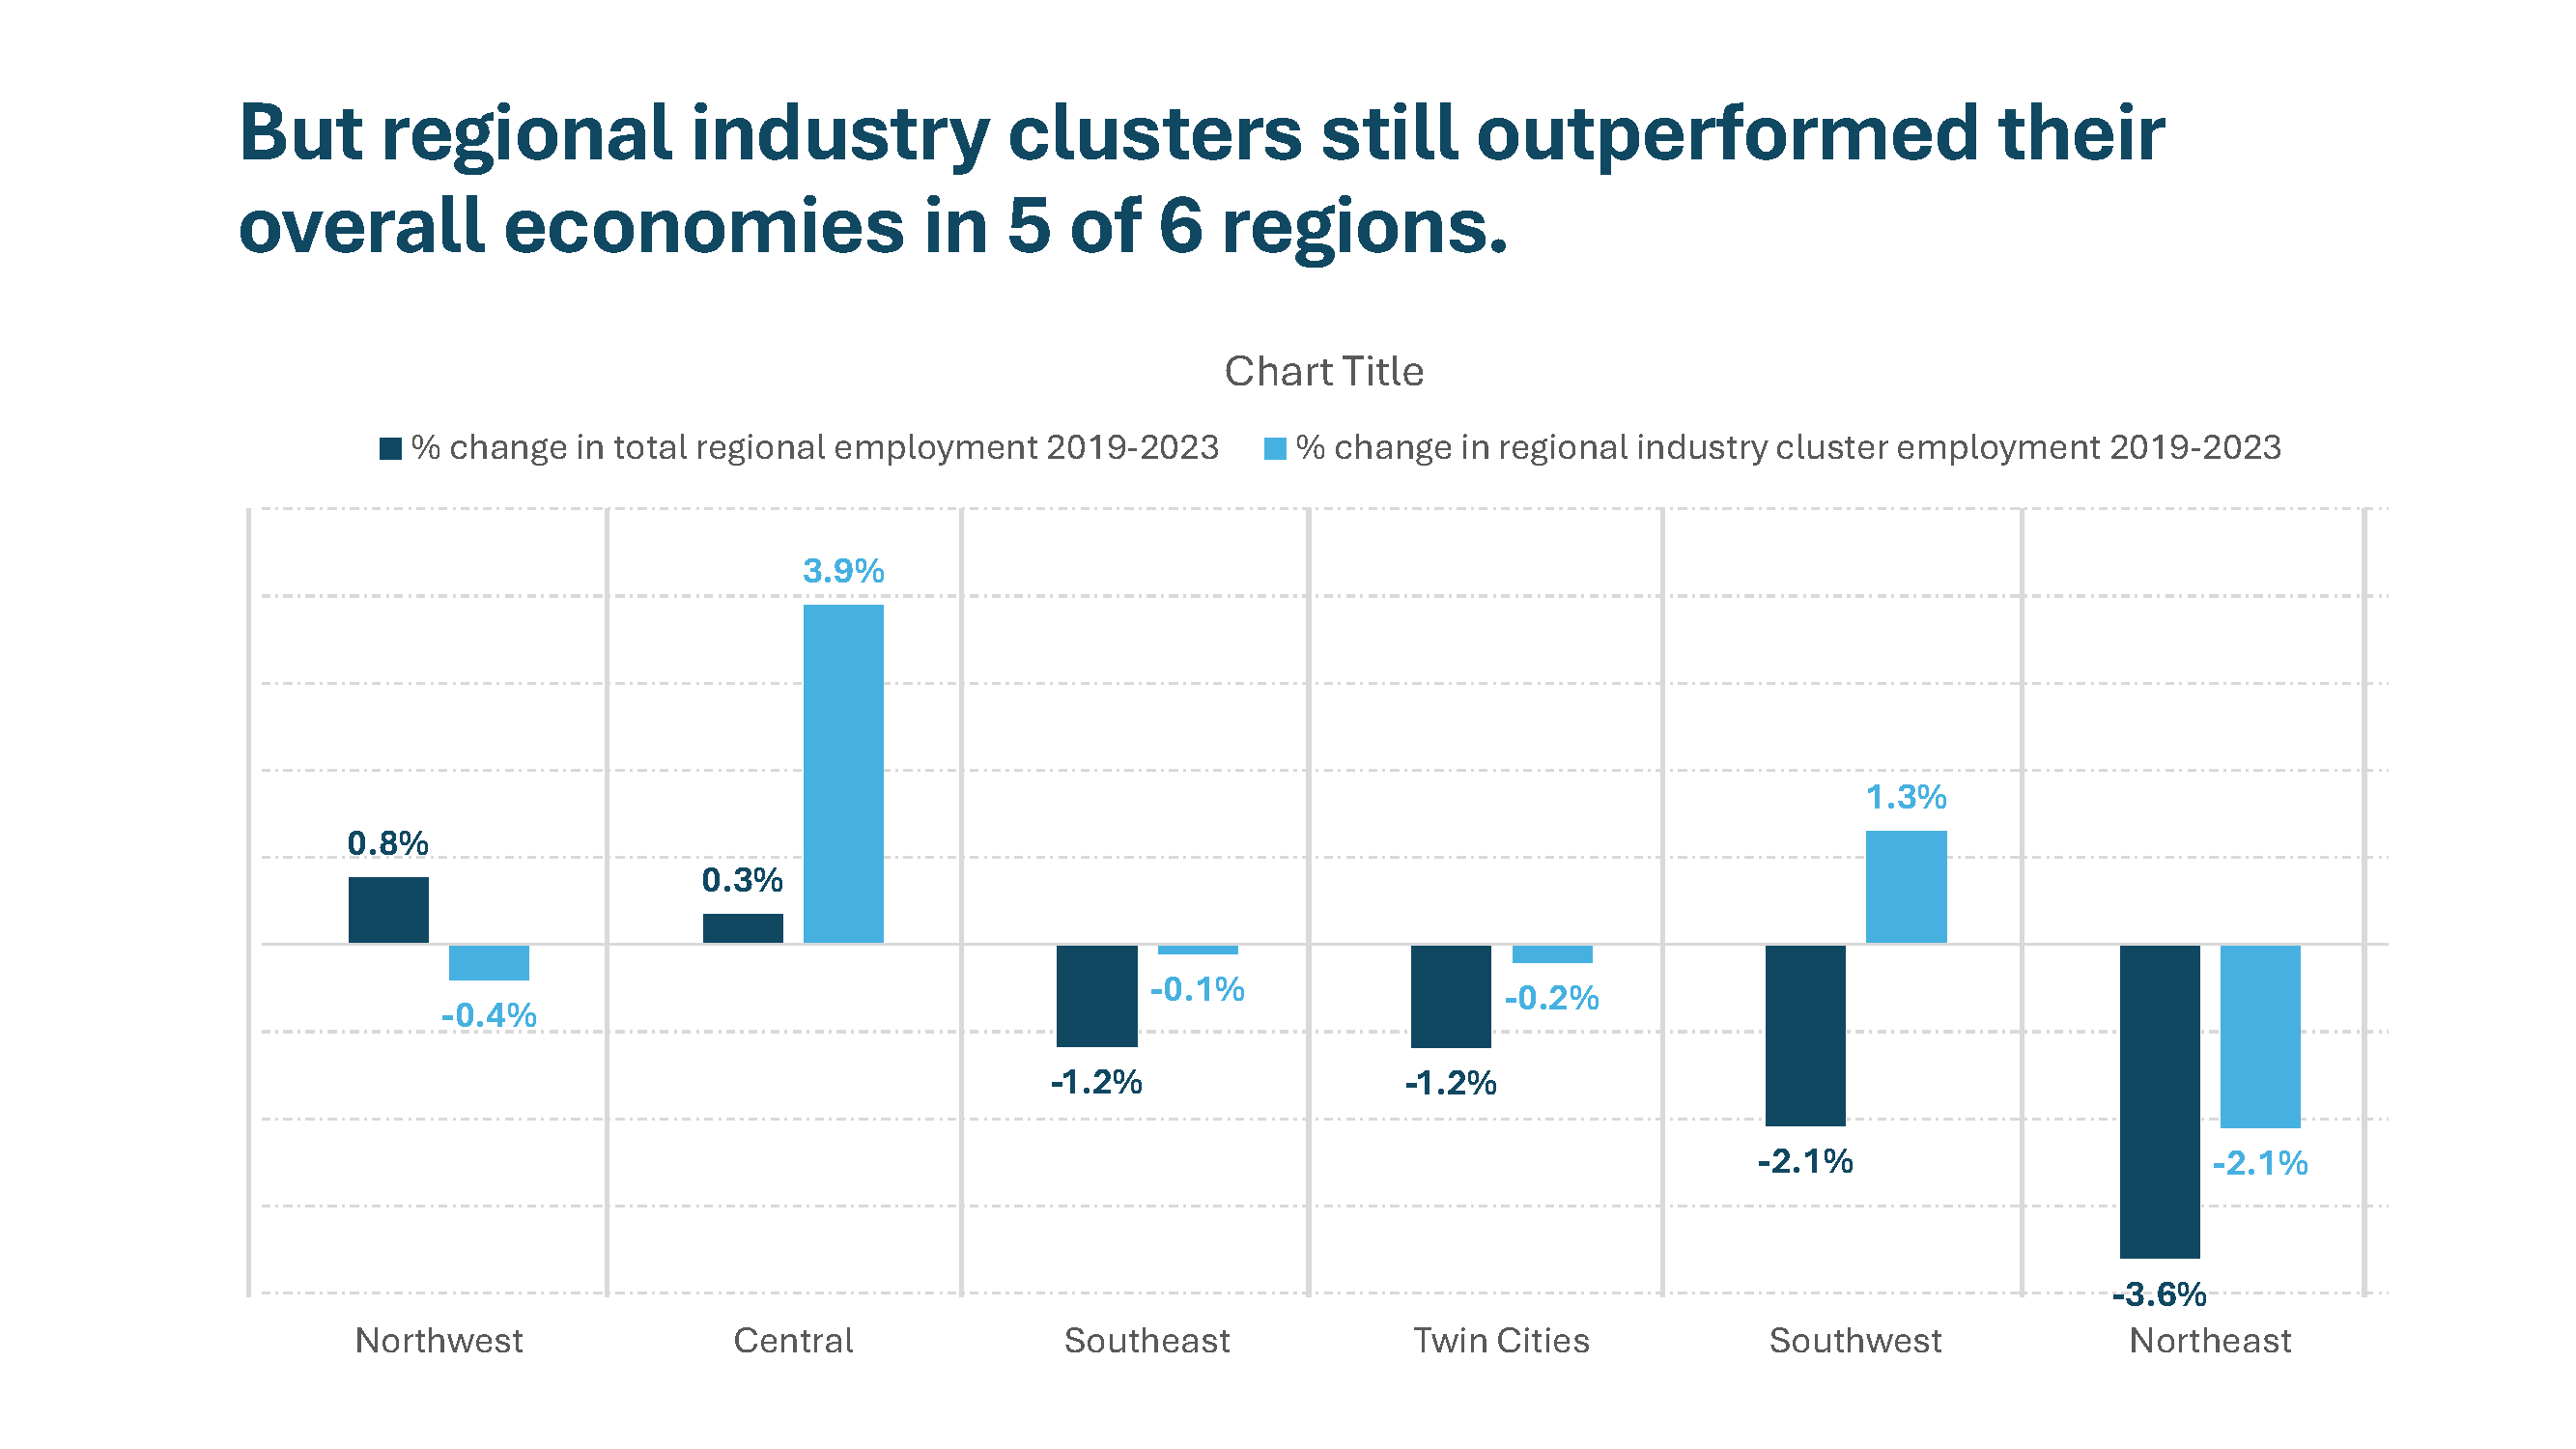
- Only two of six regions added jobs in their regional industry clusters from 2019-2023. However, in all but one region, the regional industry clusters outperformed their respective economies as-a-whole.
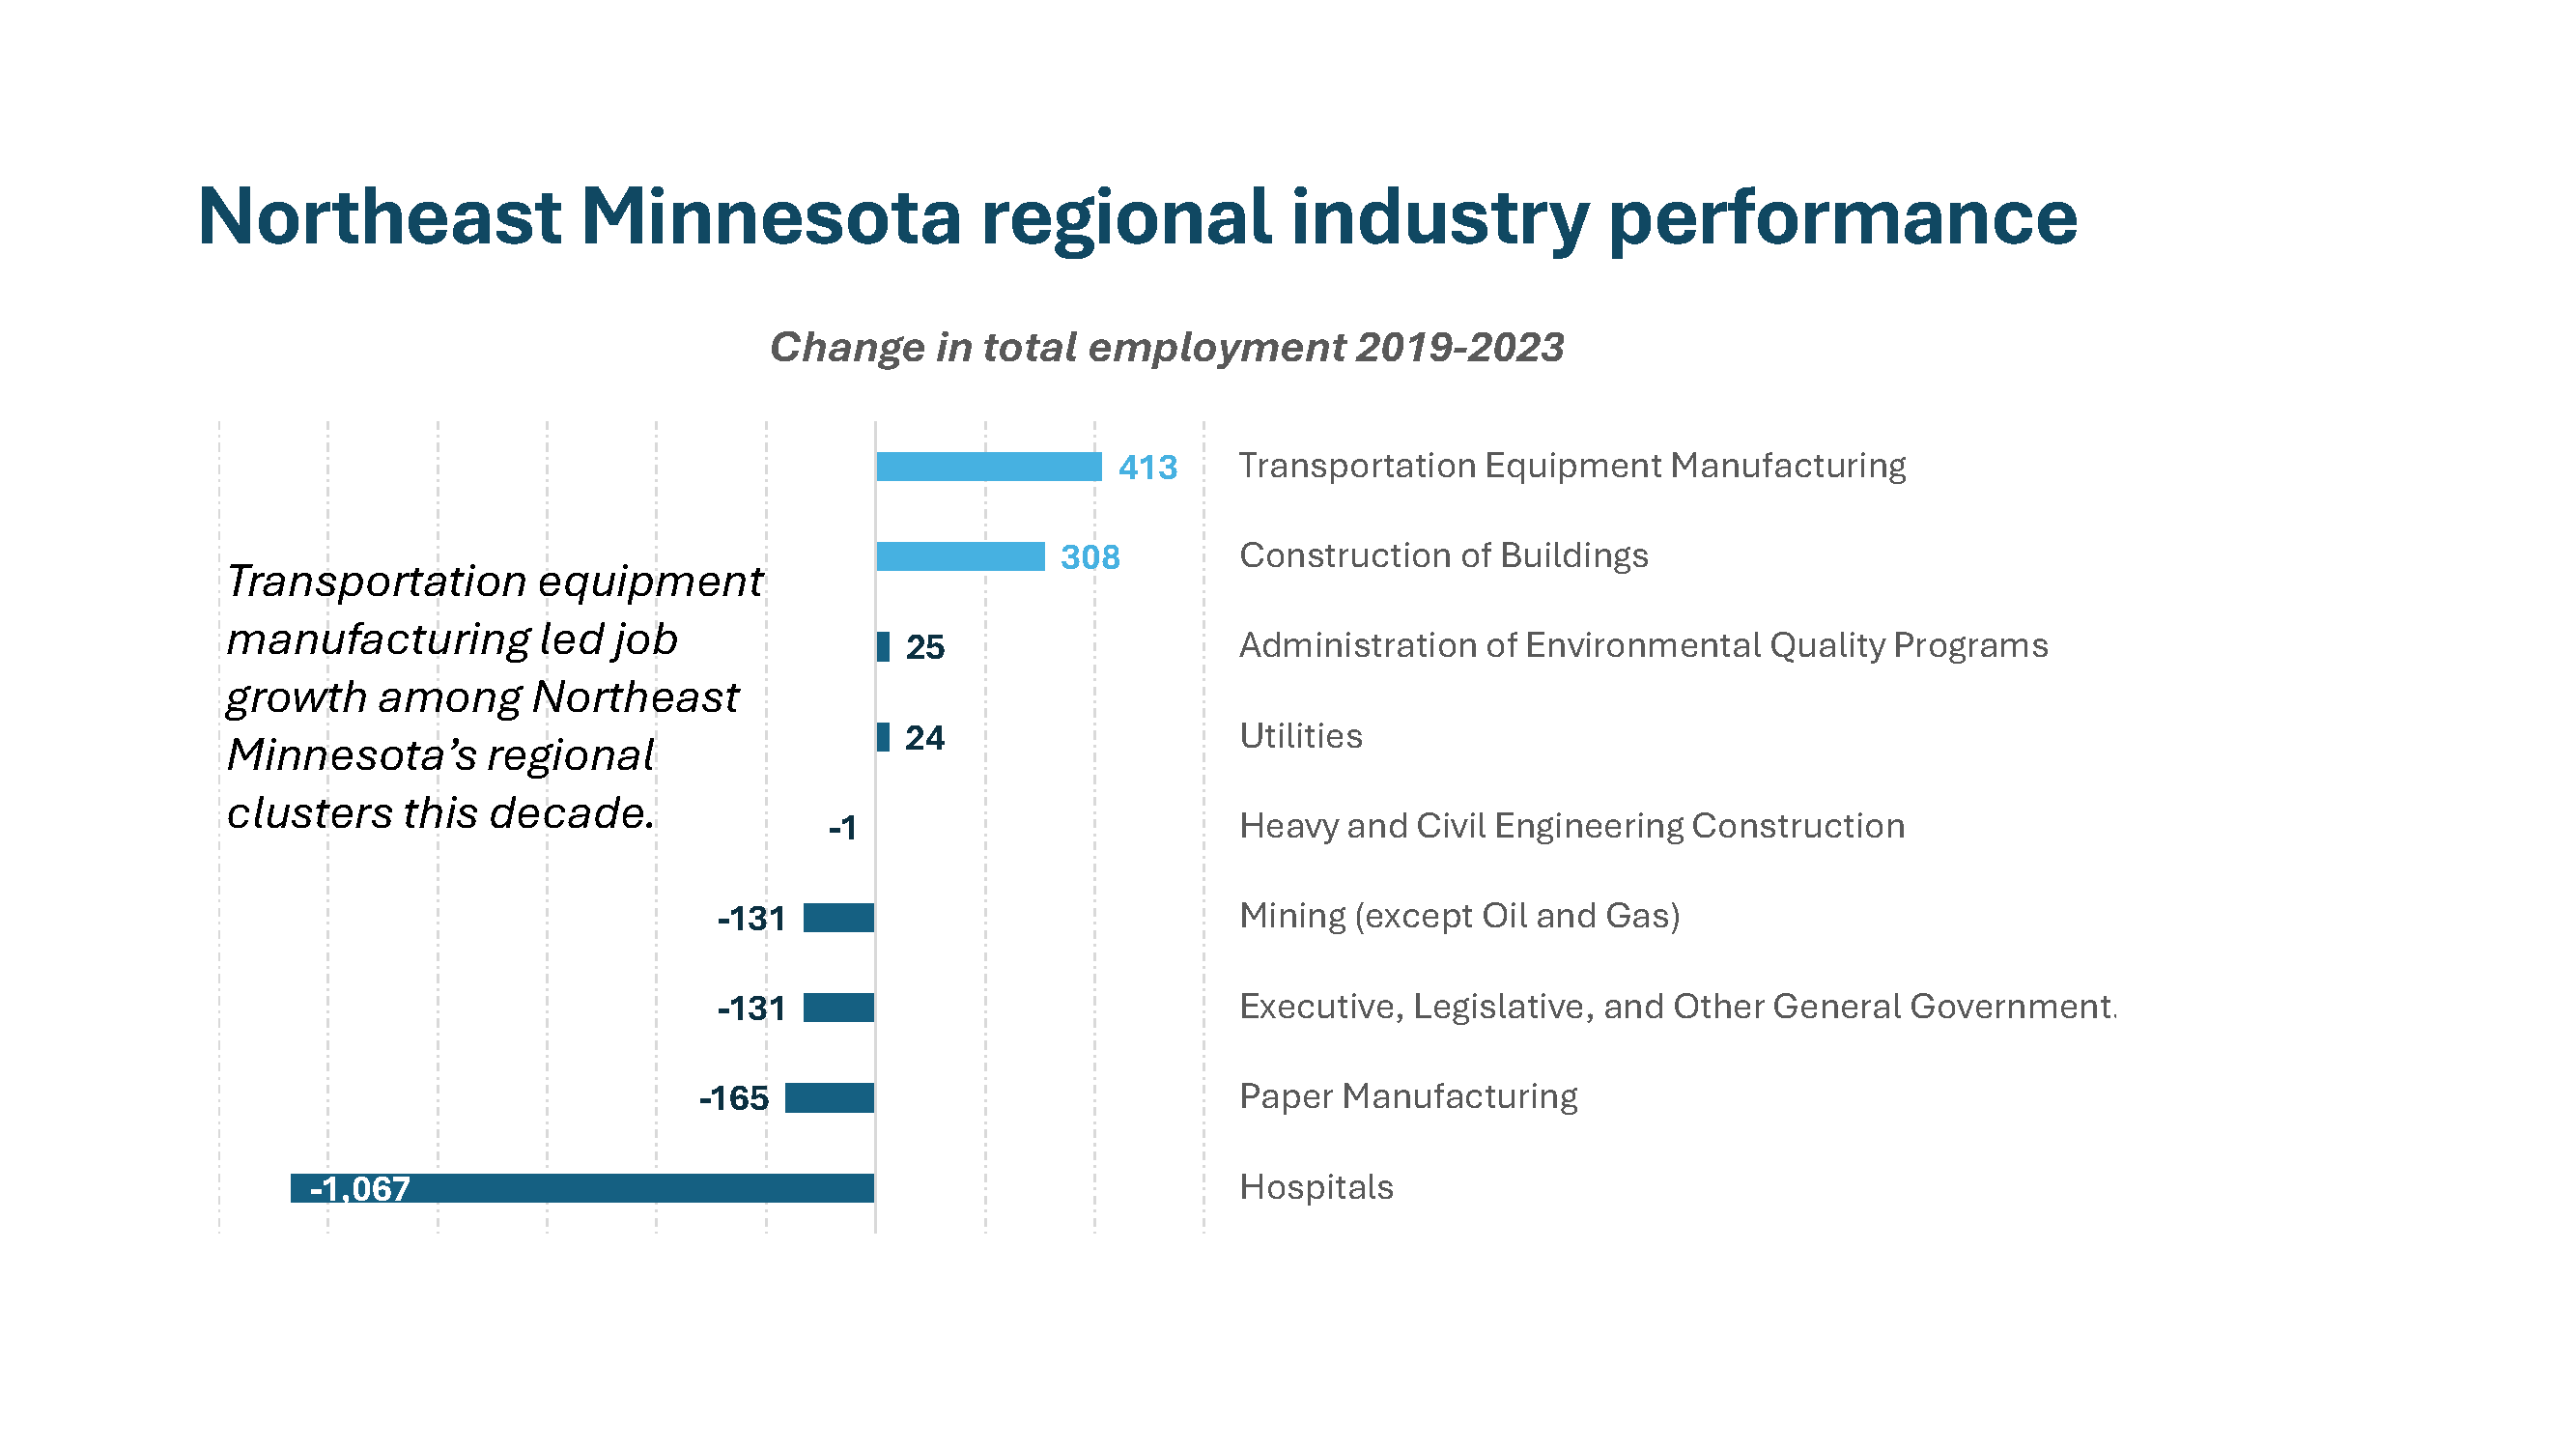
- Each region had examples of specialized industries that grew at a healthy pace this decade. For example, Northeast Minnesota had declining employment overall since 2019, but its transportation equipment manufacturing industry grew by a rapid 7.2% annually, driven in part by the Duluth area’s aerospace sector. Likewise, machinery manufacturing grew by 3.1% annually in Central Minnesota, far outperforming the region as-a-whole. Health care services added jobs in Southeast Minnesota and miscellaneous manufacturing (which includes medical goods) drove growth in the Twin Cities.
- Each region also included examples of important industries that experienced substantial losses. For instance, health care services in Northeast, insurance carriers and management of companies (i.e. corporate headquarters offices) in the Twin Cities, and manufacturing of computer and electronic products and nonmetal mineral products in Southeast all had notable declines in jobs over the first four years of the decade.
- Total wages paid in these regional industries were $5.9 billion higher in 2023 than in 2019, despite negative job growth in most regions in that time. A combination of wage inflation and productivity gains may explain this rise in total payroll even as the number of jobs in these industries declined in four of six regions.
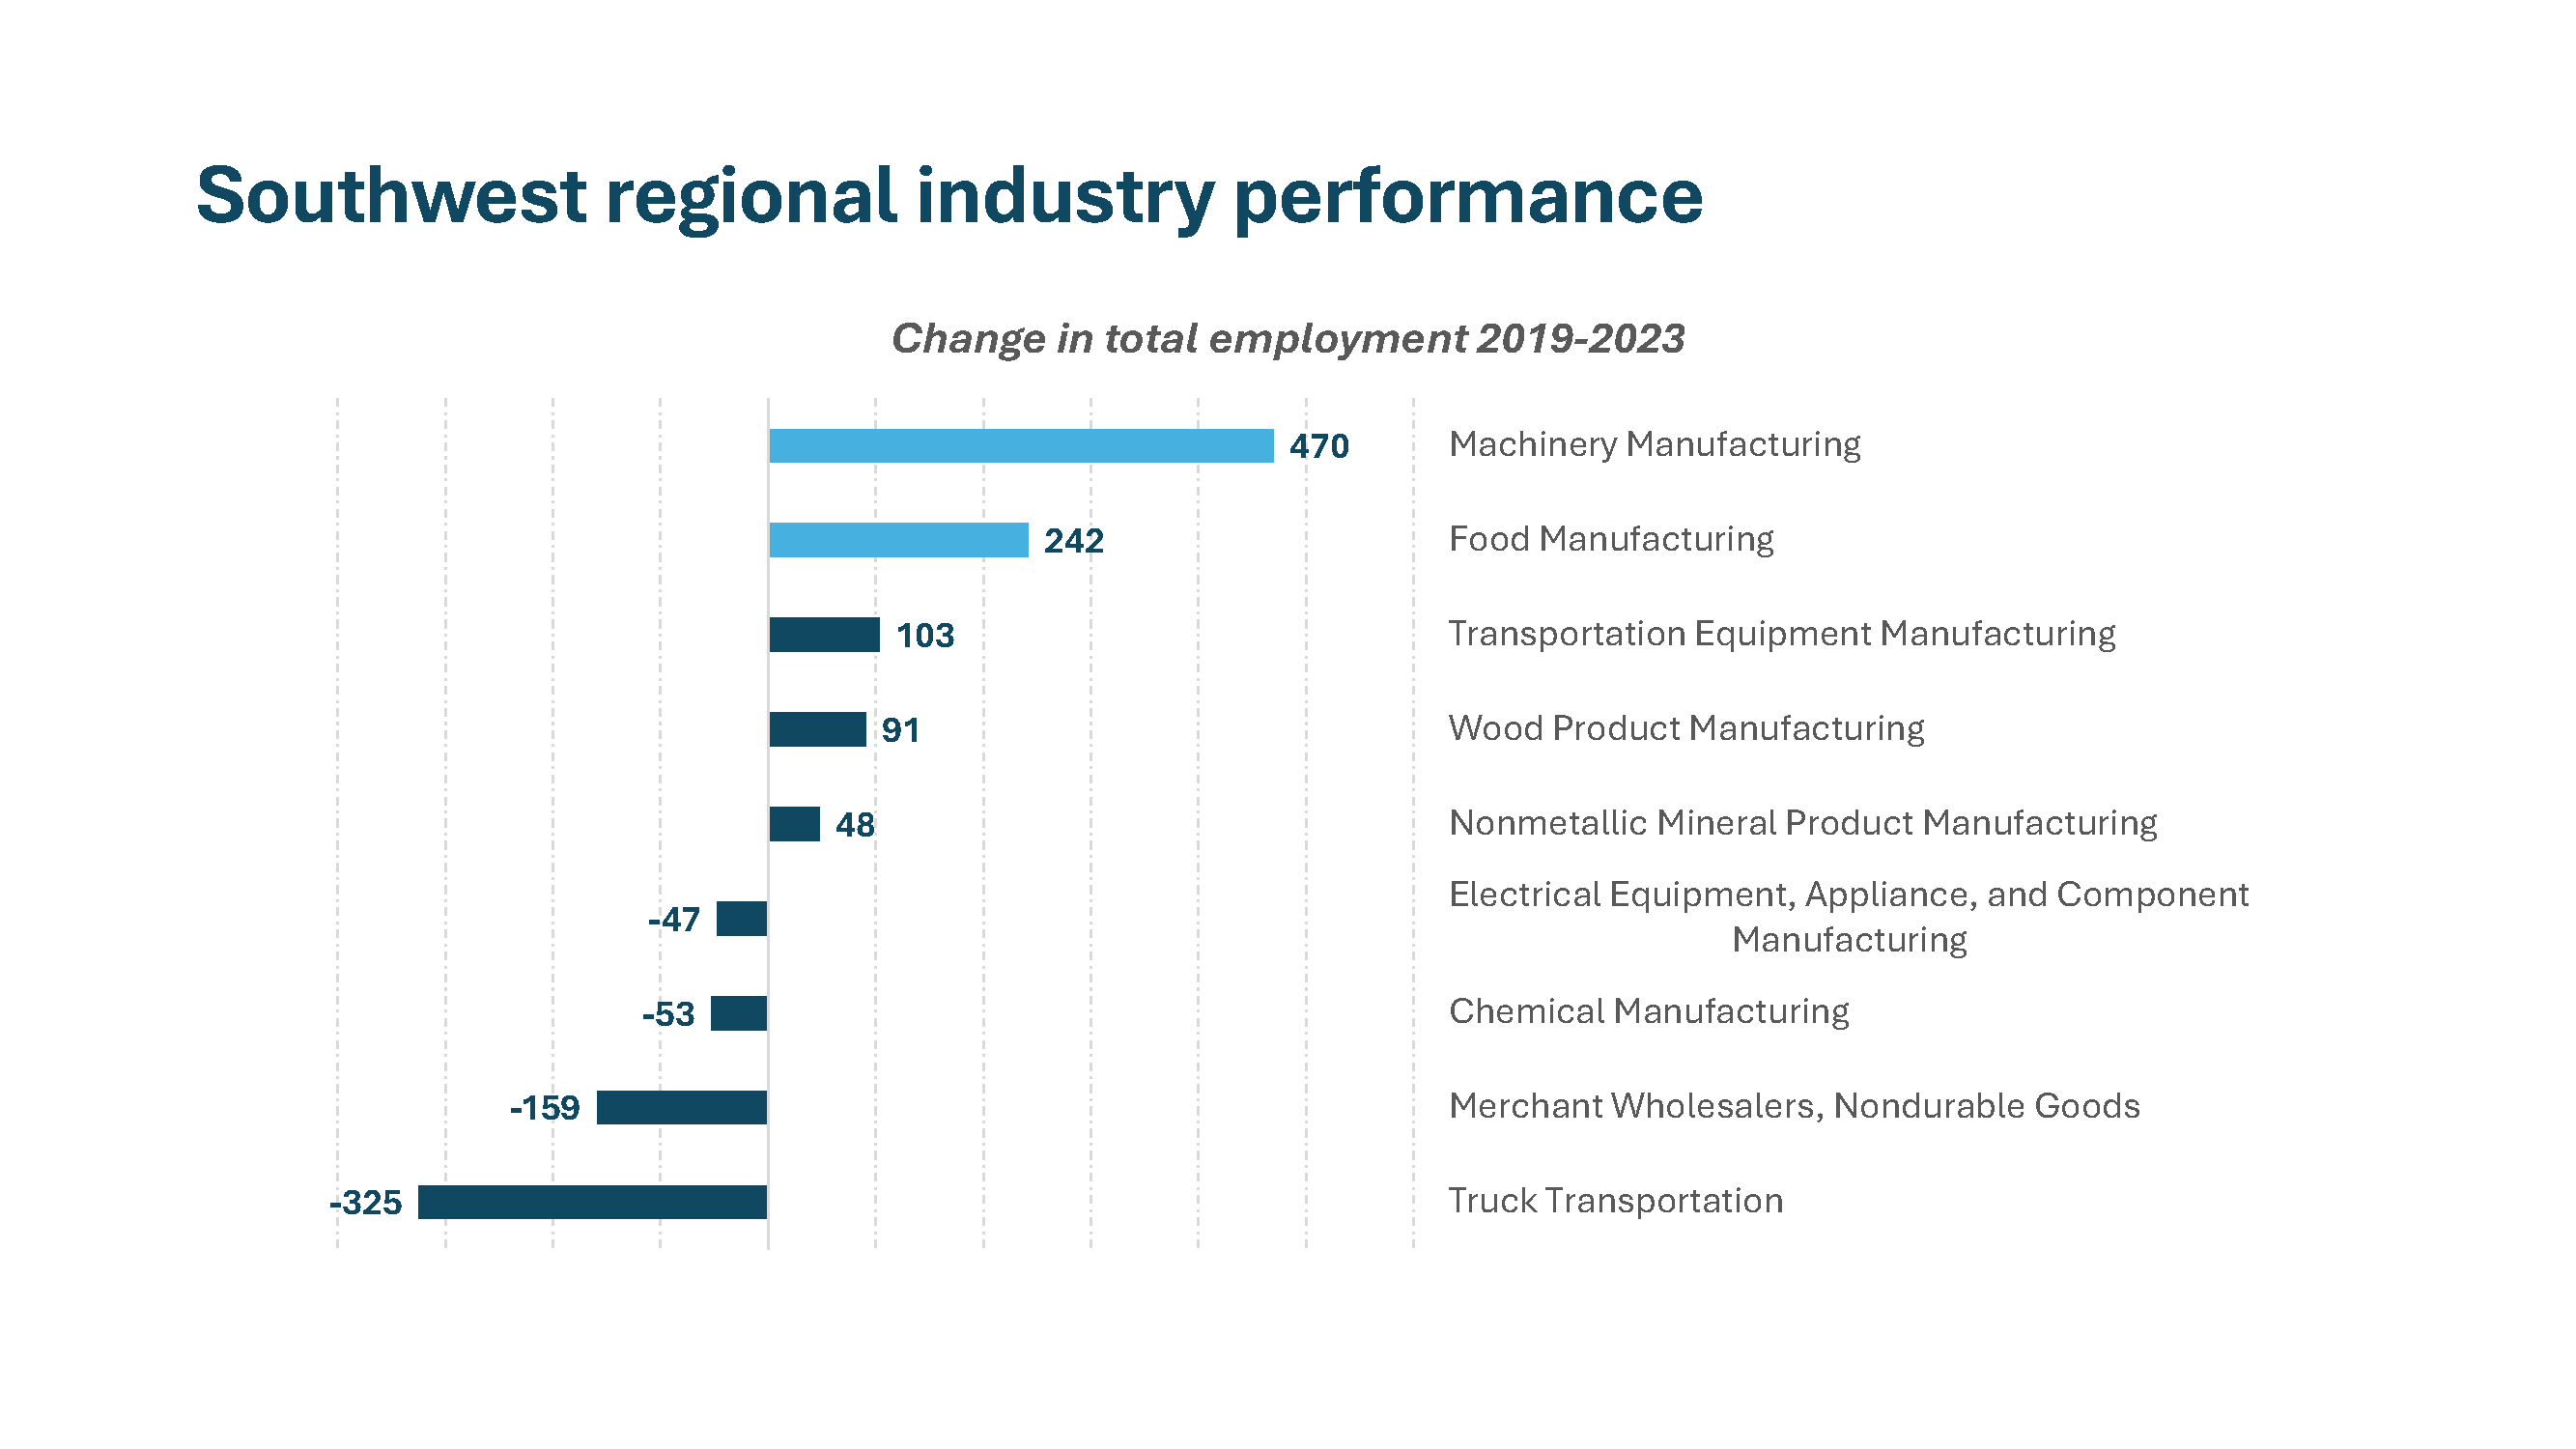
- Some industries are heavily concentrated in just one region in Minnesota (e.g. mining in Northeast Minnesota), but four industries have high employment concentration in several regions across the state. These included food manufacturing, transportation equipment manufacturing, machinery manufacturing, and nonmetallic mineral product manufacturing.
SHARE
Recommended Articles