What can Minnesota do to better attract businesses? | Sponsored content from The Brookshire Company
The below is sponsored content courtesy of The Brookshire Company. For more information or to sponsor content, contact Elizabeth Sherry.

By: Royce Pavelka
Vice President
The Brookshire Company
My name is Royce Pavelka and I am a site selection consultant. I grew up in Hopkins, MN. My dad grew up in Hopkins. My grandpa grew up in Hopkins. My great grandpa grew raspberries in Hopkins. I am Minnesotan through and through (okay, okay, technically I was born in Oceanside, CA, but I only spent 4 months there).
I begin this way because I love Minnesota. I am always seeking the good for this state. I want to see my neighbors, my community and my state thrive!
Yet, when I put my site selection hat on, I need to look at things more objectively than I normally do through my purple- and gold-colored glasses.
Minnesota has some great things going for it, but also challenges. Some of those challenges are self-induced. Some of those challenges are just a matter of fact.
It’s cold sometimes.
We have a big lake, but no ocean.
The largest metropolitan areas in the U.S. are generally far away.
So, what changes when I put on my site selection hat compared to my Viking horns? For those not wanting to read everything that follows, I will sum it up this way:
Where Minnesota wins: education, specific industry sectors like life sciences and agribusiness, cost of living, median household income, labor participation, incentives (kind of).
Where does Minnesota lose: legislation, taxes (corporate and income), population growth, supply chain, training pipeline, workforce age, employee growth, incentives (kind of)… and it is cold.
For those wanting a bit more meat on the bone, here are two scenarios we wanted to run to test knee jerk assumptions about how Minnesota compares to other states in the region (Iowa, North and South Dakota, and Wisconsin) and to a few national competitors (Arizona, Texas, Tennessee, and North Carolina) getting a lot of attention:
Scenario 1: a life science company looking to grow or expand, needing 250 employees
Scenario 2: a metal fabrication company looking to grow or expand, needing 250 employees
(Disclaimer: assumptions were made on industry sector, weighting of criteria, and labor pro forma)
Before we jump into the data comparing the two, we can knock out a few criteria right away that will have minimal change between scenarios.
TAXES
Let’s start with taxes, both the corporate tax rate and the income tax rate. Below are two maps, dark blue is bad. Sorry, did I color that too much with my own personal thoughts? The darker the blue, the higher the tax rate.
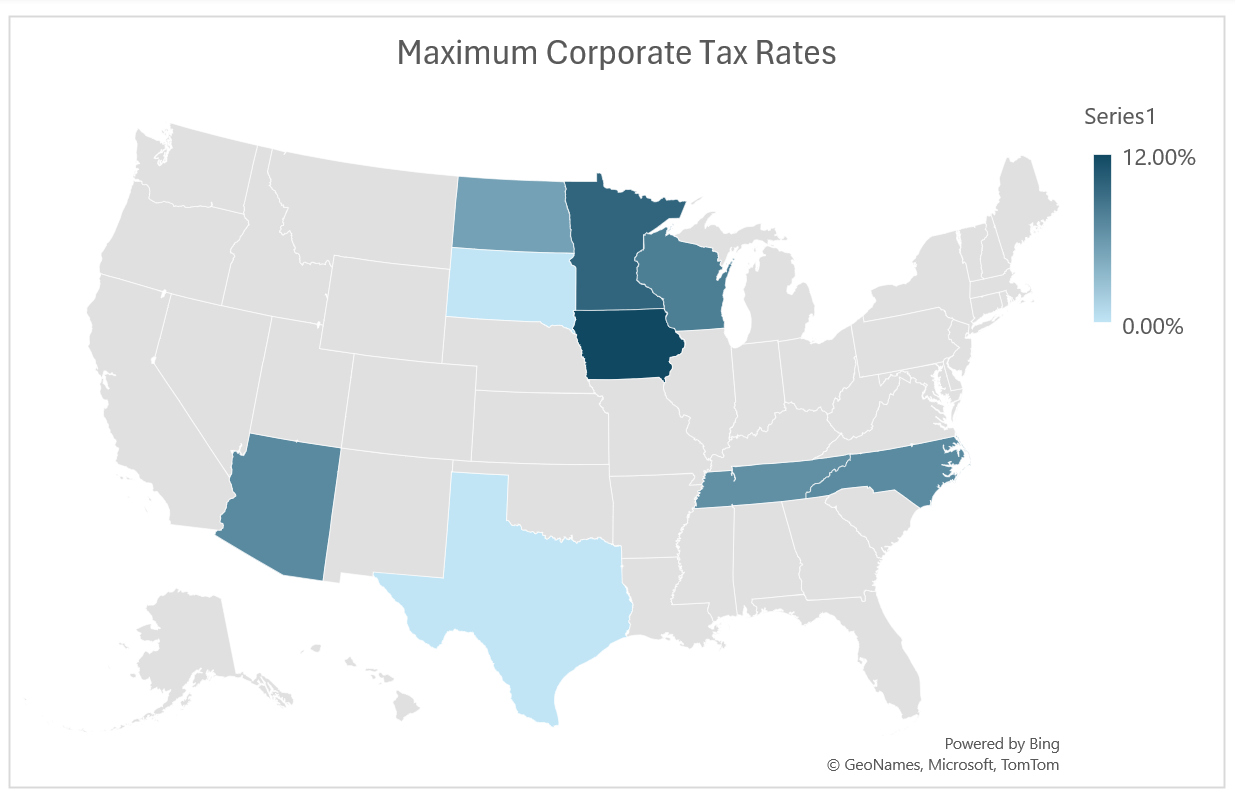
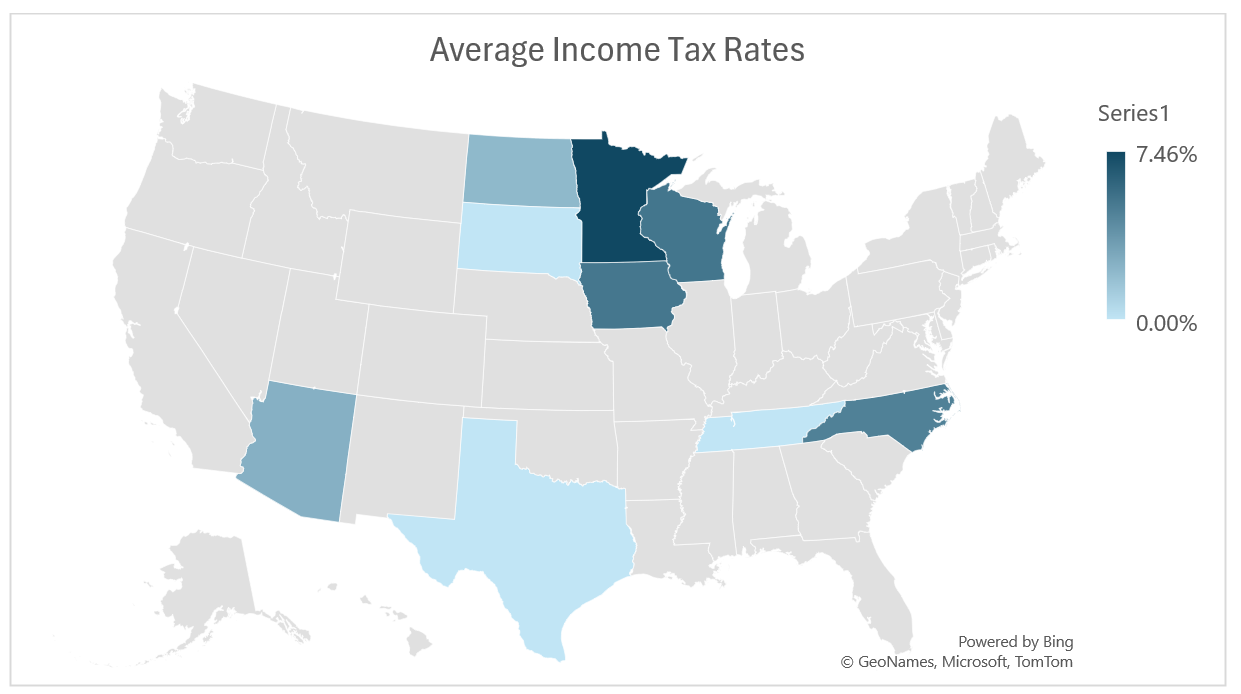
Minnesota is the highest or second highest in both. And when Iowa fully realizes their corporate tax rate reductions being phased in over the next few years, Minnesota will be the highest in both. Don’t get me wrong, the government gets theirs one way or another. BUT – when you are taxed on income from the jump either through your business or your personal income, it is easier to quantify and therefore measure the potential impact to a business and employees.
SUPPLY CHAIN
Supply chain became a real hot button topic during Covid as international trade routes came to a screeching halt. Logistics, intermodal strategy, drayage cost, and proximity to interstates have always been factors when comparing locations, but the importance of our national supply chain has only been heightened as companies look to take greater control over where they get resources and where their goods go.
Now, this is a case-by-case scenario. If you need feed stocks, wood, access to other agricultural products at various stages, etc. Minnesota can be a great location. However, Minnesota’s location of being a northern state in the middle of the country means it is geographically isolated from the coasts and major population centers. This is a factor Minnesota can never change and needs to play to its strengths regionally.
LEGISLATION
Legislation is a trickier criterion to quantify. In general, we try and look at recent track records. Are states enacting legislation that trends towards business friendliness? We will let you dig deep into articles published previously by the Minnesota Chamber itself so as to save time here, but needless to say recent trend lines are moving aggressively against pro-business policy. One significant example: Paid Leave .
Here is your Paid Leave primer:
Paid Leave will be fully enacted in January of 2026. It requires businesses to pay into the program. The program is administered by the State. Employees interface directly with the state, not the business for utilization. Employees will be able to take 12 weeks off annually for medical leave and 12 weeks off for family leave, however it is capped at 20 weeks total for the year. Employees are guaranteed their same job back. Employees earn a portion of their normal pay during this leave period.
Here is the issue from a site selection perspective: this will require an increase in the anticipated employee count and overall payroll estimations. For some companies this will be less impactful. For manufacturing, retail, and positions that require people to be present daily for production, it will have a potentially significant impact.
INCENTIVES
Another aspect of any deal we work is the potential for local to state level incentives. No project should be driven by incentives, but they are important to the final feasibility of any growth or expansion project. And Minnesota, to the surprise of some, is relatively aggressive compared to our neighboring states. For most projects we would anticipate Minnesota providing the second most financial incentives on any project that meets criteria, behind only North Dakota (if you do have a project that can be bought, North Dakota is open for business!).
However, the process and scrutiny behind receiving those incentives is significantly more cumbersome than our neighboring states, and quite frankly most of the lower 48. We do have great programs that can really help companies invest in their people and infrastructure. But there are hurdles and administrative challenges, specifically additional levels of government bureaucracy and process impediments that can put projects being awarded incentives at risk.
When compared nationally, we have found that as states heat up with expansion projects, read Texas, they will often times cut incentives as they become less reliant on those programs for attraction. States that boast low corporate and personal income tax rates likewise tend to offer few incentives as programs are driven by tax generated revenue.
All that said, Minnesota comes out as a winner if you have the wherewithal to undertake the more heavily scrutinized process that surrounds Minnesota incentives.
GOOD NEWS
Now for some good news. When it comes to factors often related to quality of life, Minnesota ranks decently well.
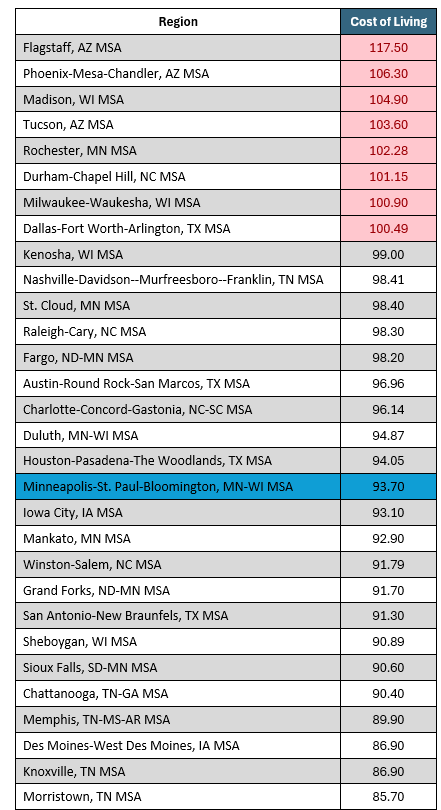
Cost of Living* - 93.7 for Minneapolis/St. Paul (100 is the national average):
*Note: this is an adjusted cost of living metric that focuses on specific buckets of comparison as it pertains to mid-level employment positions and above. Other more generalized cost of living indices have the Minneapolis-St. Paul region slightly above national average around 102, while MN as a state tends to trend just below national average.
Median Household Income - $94,934 (highest of the core MSAs in the results that follow):
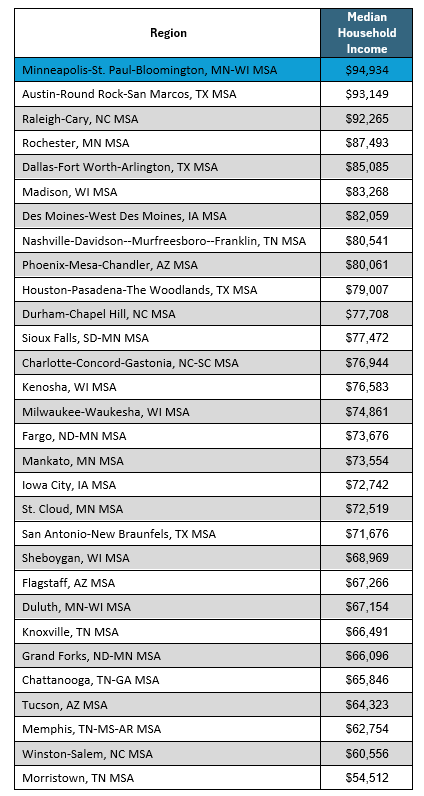
Median Household Income to Median Home Value Multiple - 3.53:
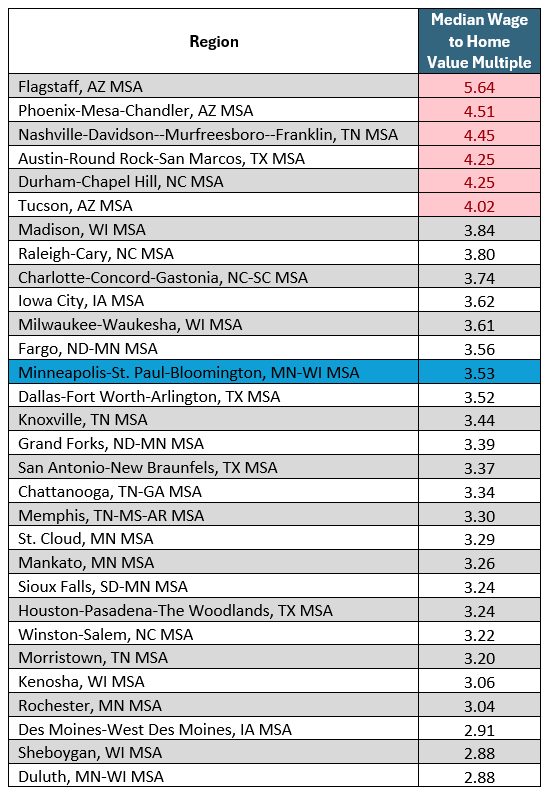
These factors all point to a quality of life that can be attractive to companies, especially those that will have higher paying jobs as the cost of living and housing remains (relatively) affordable.
Now that we have addressed some general points of comparison, let’s dive into a couple of tangible project models.
2 RANKED MODELS
Sticking to a comparison of the nine previously mentioned states, we ran two separate high-level projects: one focused on life science manufacturing, one focused on metal fabrication manufacturing. Both manufacturing, but different industries.
How did Minnesota (Minneapolis/St. Paul specifically) stack up nationally:
- 8th in the nation for life science manufacturing
- Highest of all major MSAs in the 9 states surveyed
- 118th in the nation for metal fabrication manufacturing
- Every state in comparison has an MSA that scored out higher
- Fargo, Sioux Falls, and Des Moines were all in the top 100 markets
- Notable top 50 markets:
- Janesville/Beloit, WI (50)
- Wausau, WI (48)
- Pheonix, AZ (47)
- Nashville, TN (42)
- San Antonio, TX (41)
- Dallas, TX (40)
- Charlotte, NC (35)
- Chattanooga, TN (27)
- Austin, TX (10)
- Knoxville, TN (1)
Now this is just a first pass focused purely on quantitative data. But what it highlights should be ruminated on by all of us in Minnesota. Why the staggering difference?
LIFE SCIENCE
Let’s start with why life science manufacturing scores out well: education, concentration of similar industries, and labor participation.
EDUCATION
Minnesota scores out on top for having a well-educated workforce. For projects in the life sciences, this is huge. In general, if you need a workforce that has a high ratio of necessary 4-year degrees, Minnesota is going to show extremely strong. And this is the exact case in the life sciences, for many companies the final labor pro forma for a new project will be dominated by those needing degrees in engineering, medicine, finance, and business administration.
SIMILAR INDUSTRIES
Thank the likes of Medtronic, 3M, Boston Scientific, and Abbott for their long-term investments in the state. Companies often look for locations with similar companies in close proximity. There are myriad benefits to locate close to those in your industry or adjacent to it: talent pool, knowledge base, vendor relationships, supply chain, acquisition opportunities, and sheer familiarity are just a few. Some companies will eventually ding a region for an over-concentration of industry, but this is a subjective line, and in general, the positives will outweigh the negatives for the majority of companies.
LABOR PARTICIPATION
Minnesota has an engaged workforce. When you combine an engaged workforce, with an educated workforce, you get a high level of availability within specific categories. This doesn’t mean people are sitting on the sidelines waiting for an opportunity. But what it does mean is that if you are a life science company (for this example) looking for qualified employees, you will be able to find them in Minnesota… You just might need to steal them from your competition, c’est la vie.
METAL FABRICATION
If Minnesota has an available educated engaged workforce, why did metal fabrication manufacturing score so much lower? (Note: 118th in the nation is not BAD, per se. But in comparison to our neighbors and other growing markets, it is falling behind) The answer is pretty simple, we have a comparatively limited blue-collar workforce in a community that has a strong deviation in economic strata.
TRAINING AND AGE PIPELINE
Minnesota is not keeping up when it comes to industry specific education in the trades. We are nearly half the national average in fact. So, while we have a very educated workforce, we are producing talent with degrees in non-industry applicable categories. And to make matters more difficult, we are not adequately replacing older talent with younger talent. Minnesota is barely covering a 1 for 1 replacement in jobs specific for metal fabrication manufacturing.
But if we are replacing the workers leaving, isn’t that a good thing? No! As our national economy and population grows, we need to be replacing retiring workers at a greater than 1:1 ratio.
POPULATION AND EMPLOYEE GROWTH
To piggyback off the previous point, Minnesota is simply not growing as fast as other regions. Note the following map, the warmer the color, the faster the growth (grey is stagnant or losing population).
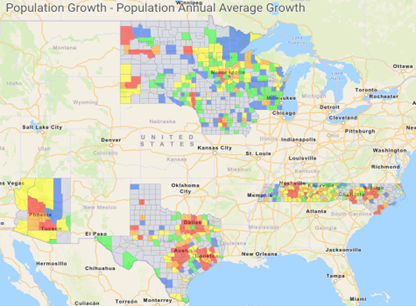
To no one’s surprise that has been watching the news over recent years, especially since Covid, the southern states are showing a faster growing population, and in general, these increases are focused heaviest in metro areas (we could have an entire other conversation on the state of rural U.S. communities).
Companies are in desperate need of people. Going where the people are is at the very core of most company decisions. It is not only because that is where the labor is. It is also because the shift in population comes with a shift in economic centers of influence.
At the end of the day, companies need people to work. Companies also make products or sell services bought or used by other people or companies.
QUALITATIVE FACTORS
We have looked at a lot of data, And as much as any actuary would love to believe final decision are made on cold hard data, people are at the heart of any final decision on where to locate or expand. And people have biases.
If the CEO went to the University of Minnesota, there is a good chance Minnesota will start on the positive side of the ledger. And no matter how well Madison scores out according to the data, there is no way the project is going to Badger country.
People bring their desires to the site selection process. If you like being outdoors, Colorado looks great. The ocean, how about the Carolinas? Scared of hurricanes, well let’s scratch the Carolinas.
We are Minnesotans, we try to lean into the cold and act tough about it. We make the best of it because we have to! Unfortunately, a lot of people do not like being cold. Again, nothing we can do about it.
SO WHAT?
So, what can Minnesota do to be more attractive to companies if data doesn’t drive all decisions and people come loaded with biases that may hinder Minnesota in the first place. Simple, we need to remove the hurdles we can.
We can’t move the state. We can’t change the weather. Population trends don’t change overnight.
We need to keep leaning into our educated workforce. And highlight the quality of life offered to employees.
We also need to focus more of our legislative efforts on being more competitive from a tax perspective, investing in education for the trades and manufacturing, and making the good things about our state more accessible (remember the incentives discussed above… Oh yeah, and the environmental permitting process… again for another day).
Minnesota is my home. Minnesota shouldn’t try and be Texas, Iowa, or North Carolina. We need to be the best version of Minnesota we can be. I can give you every reason in the world I like living here, but those reasons will not translate to the national and international levels when trying to attract growth and investment.
Let’s continue to focus on industries we are primed to succeed in (life sciences and agribusiness for example), leverage our skilled workforce to attract more investment, and incrementally work to better ourselves where we are currently at a competitive disadvantage. Skol!
i Scenarios run through JobsEQ
ii Map data utilized from tax-rates.org
iii For more information visit paidleave.mn.gov
The below is sponsored content courtesy of The Brookshire Company. For more information or to sponsor content, contact Elizabeth Sherry. Views expressed in sponsored content reflect those of the author and not the Minnesota Chamber of Commerce.
Looking to dive deeper?
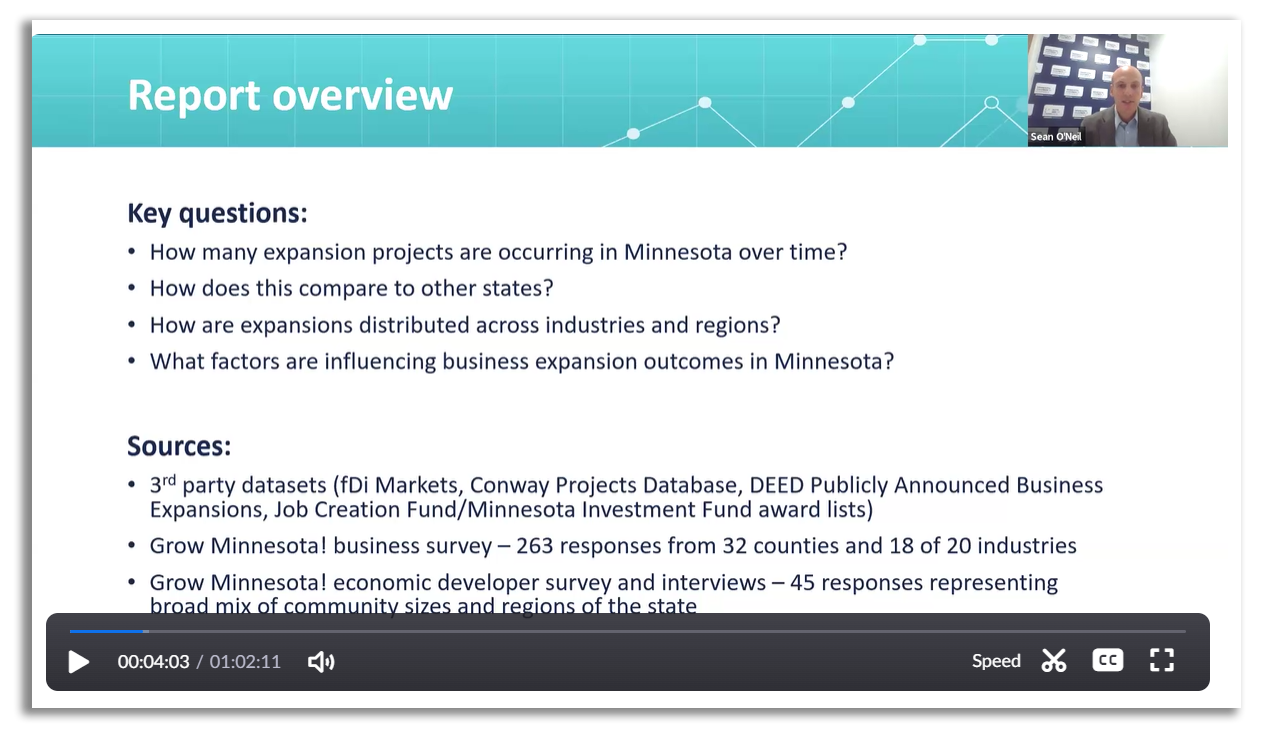
On-demand webinar: 2024 State of business expansion discussion with Grow Minnesota!®
SHARE
Recommended Articles