The Economic Contributions of Immigrants in Minnesota: Demographic analysis
Demographic analysis
-
As Minnesota’s population ages, international migration is a key to future population growth.
-
Minnesota’s net international migration has been positive over the past two decades and has offset the loss of Minnesota residents leaving for other states.
-
A higher percentage of the foreign-born population than the native-born population is of working age (18-64).
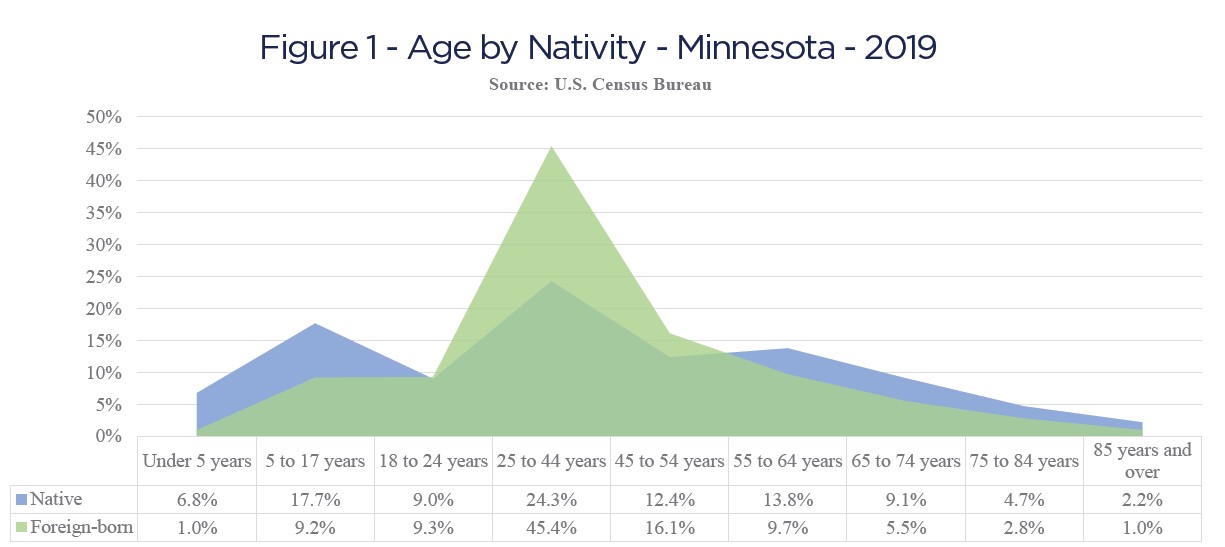
Minnesota’s demographics are shifting and the population is quickly aging. According to the State Demographer, deaths will outnumber births by the early 2040s. For Minnesota to experience meaningful population growth in the future, it will need to come from migration to the state. Thankfully, a growing number of immigrants call Minnesota home. While domestic net migration was mostly negative from 2002 to 2019, net international migration remained steadfastly high. Immigrants arriving in Minnesota are younger on average than native-born Minnesotans, and play an oversized role in the labor force. 81% of the foreign-born population is of working age (18-64) while only 60% of the native-born population belongs to this age group. Figure 1 illustrates the high percentage of the foreign-born population that is working age while the native-born population is more evenly spread out across the age spectrum. According to the Minnesota Department of Employment and Economic Development (DEED), the number of immigrants in the labor force increased by 40% from 2006-2016. Nationally, immigrants become
entrepreneurs at higher rates than the native-born population; however, this trend does not hold true in Minnesota.

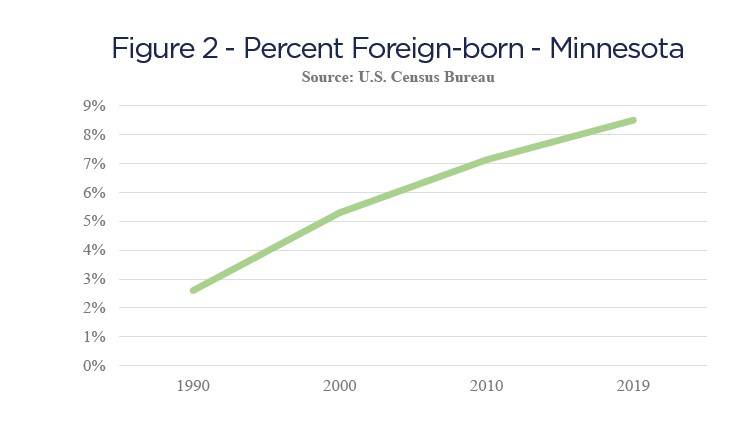
Minnesota’s immigrant population totals 472,849 individuals representing 8.5% of the state’s total population, meaning one in 12 Minnesotans is foreign-born. Figure 2 shows that this number increased in the last 30 years from 2.6% in 1990. During that same time period, the immigrant population in the Twin Cities metro area grew from 3.8% to 10.5%. Compared to national immigration trends, the growth in immigrant population here is outpacing the growth in other states and nationally. Between 1990 and 2018, the state’s immigrant population grew by over 300%, while the national immigrant population grew by 126%. The total number of unauthorized immigrants in Minnesota is not precisely known, but it is estimated to be around 95,000, which represents 20% of the foreign-born population and 2% of the total state population. 
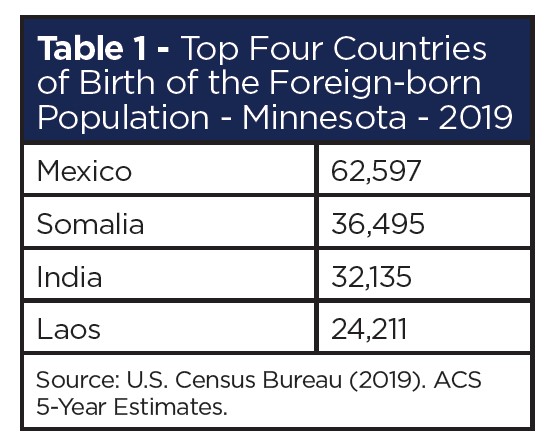
Analyzing the place of birth for Minnesota’s foreign-born population shows the diverse backgrounds of this group. Asia is the place of birth for 38% of Minnesota’s foreign-born population, followed by Africa at 26% and Latin America at 24%. The top four countries of birth among the foreign-born population in Minnesota are Mexico, Somalia, India and Laos (table 1).
It is important to differentiate between immigrants and refugees in this analysis. Refugees—as opposed to immigrants—flee their home country and are resettled with little, if any, choice in where they initially live. After the initial resettlement period, refugees have the ability to move, and a majority of them choose to move to Minnesota. Minnesota has a larger share of secondary refugee migration than all other states combined. In part, this is a result of a robust support system including access to good schools, quality health screening and care, and employment assistance. Another draw for refugees are existing communities of immigrants and refugees already here. For a ranking of Minnesota cities by foreign-born populations, see Appendix Table A4.

The Somali population in Minnesota is the largest in the United States and the Hmong population is the second largest. The Minnesota Department of Health (MDH), which tracks refugee arrivals, reported that from 1979-2018, 109,605 refugees settled here, roughly 30% of the state’s foreignborn arrivals during this time period. Refugees per capita are higher in Minnesota than in any other state. Unsurprisingly, most primary refugee arrivals resettle in Hennepin and Ramsey counties which have the second and third highest foreign-born populations of all the counties in the state.
With support from The McKnight Foundation
![]()
Navigate the report
Recommended Articles
The Minnesota Chamber of Commerce released this letter on behalf of more than 60 CEOs of Minnesota-based companies today.
The...


